Ships through time: a vintage atlas of maritime finds
/ 9 min read
Table of Contents
For Day 6 of the #30DayMapChallenge, the theme is Vintage. After following mountain views along a route, I wanted to try a different kind of map: something that looks like an old nautical chart, but uses real, source-linked records.
I was lucky enough to travel a lot of Europe as a child with my parents in a VW T2 camper and visit some of the nordic maritime museums so shipwrecks seemed a fitting subject. I started with seven historical wrecks around Britain and Ireland, then became more interested in Viking ship finds and the older wrecks of the Mediterranean. Adding those changed more than the geographical extent. A ship burial isn’t a wreck at sea, a museum isn’t the original find site, and an archaeological date often isn’t a single year.
I ended up with a small atlas of ancient trading vessels, Viking burials, medieval cogs and early-modern warships. Making it look old was the starting point; working out what each marker should represent took more care.
Explore the atlas
Open the atlas separately · Start with Vasa · View a static map
Making it look old without inventing old data
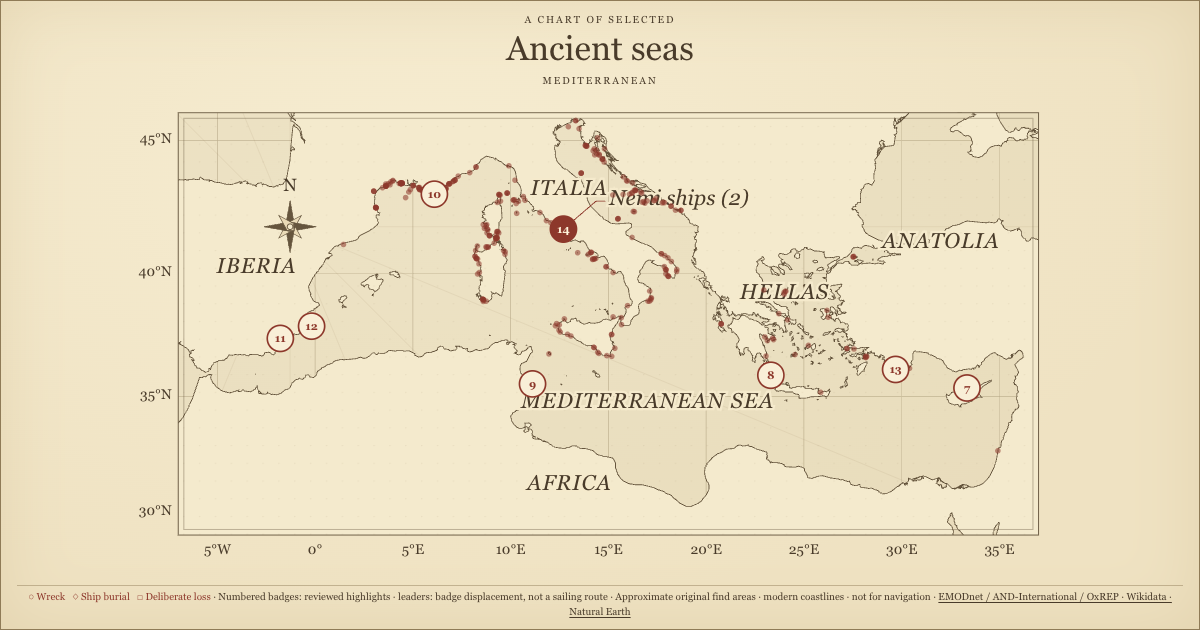
I used warm paper colours, serif lettering, a double border, a compass rose and thin latitude/longitude lines to suggest an antique chart. A subtle SVG grain pattern gives the background some texture without needing a paper photograph or a remote font.
I kept the lines radiating from the compass decorative. They suggest rhumb lines, but don’t describe any of these ships’ voyages. I also left out fictional depth soundings: they might make the chart look more nautical, but would add information I don’t have. The coastlines are modern, generalized Natural Earth geometry, not a reconstruction of a particular century.
For the controls, I stuck with the monospace style from the other challenge entries. I wanted the map to borrow an older visual language without making the interface itself feel like something you had to decipher.
What counts as a ship record?
This version shows 339 records by default. I kept the original seven later wrecks as an optional layer, bringing the full local download to 346 records.
Counting records turned out to be easier than counting ships. Skuldelev groups five vessels at one site; Mazarrón and Lake Nemi each group two. I kept those site groups together rather than making every dot stand for exactly one vessel. That’s less uniform, but closer to what the records actually describe.
| Reviewed highlights | Find-site records | Examples |
|---|---|---|
| Norse / Viking | 6 | Oseberg, Gokstad, Tune, Ladby, Skuldelev, Hedeby 1 |
| Ancient Mediterranean region | 8 | Kyrenia, Antikythera, Mahdia, Mazarrón, Uluburun, Nemi |
| Medieval / early modern | 5 | Vasa, Mary Rose, Kronan, Gribshunden, Bremen cog |
I combined these 19 highlights with 320 background archaeological records. The licensed EMODnet distribution I started from contains 321 Oxford-derived records, but its Mazarron 1 entry overlaps with the reviewed two-ship site group. I replaced that entry rather than counting the site twice.
That still leaves a partial collection, not the whole Oxford database or a complete map of European shipwrecks. A busy stretch of coast can reflect where people have looked and what the sources report. I wouldn’t read an empty area as evidence that no ships were lost there.
A museum is not a find site
Checking the coordinates was more involved than checking whether they landed on the map. A ship’s Wikidata entry may locate the museum now holding it. That’s useful if you want to visit the ship, but not if you’re trying to show where it was found.
For Oseberg and Gokstad, I used the burial-mound records rather than the ships’ museum locations. Tune has competing location statements; the map uses the reviewed Rolvsøy find location, not Oslo. Hedeby 1 uses an explicitly coarse anchor for the historic harbour area.
I ran into the same distinction with Vasa. It sank in Stockholm harbour in 1628, so I used a coarse Beckholmen-area anchor near the documented sinking location rather than its present museum. For Mary Rose, I used Historic England’s protected wreck-site centroid in the Solent, distributed through EMODnet, instead of the museum in Portsmouth.
The Bremen cog needed that check too. It was found during dredging in the Weser near Rablinghausen, Bremen, but is displayed in Bremerhaven. I used the find locality and kept a warning that it isn’t an exact excavation fix.
I rounded the display coordinates for a regional map, but that doesn’t make them accurate to the nearest kilometre. Some source locations are less precise than their decimal places suggest, and I haven’t independently surveyed them. The optional Royal Charter point also retains a known source conflict, so it needs particular caution.
Buried, sunk deliberately, or lost at sea
I gave the find types different symbols: circles for wrecks, diamonds for ship burials and squares for deliberate losses.
I didn’t want Oseberg, Gokstad, Tune and Ladby to read as ships that sank at sea. The five Skuldelev vessels were deliberately sunk as a barrier, while Hedeby 1 is interpreted as a fire ship used in an attack. Giving them all an ordinary wreck symbol would hide much of what makes the finds interesting.
I included the Nemi ships too, using a Lake Nemi anchor. They were two Roman lake vessels, not Mediterranean sea wrecks. Their 37–41 CE range describes construction/use under Caligula; it isn’t an established sinking date.
Vasa’s initial absence was a useful reminder of how the selection shaped the map. Neither the ancient Mediterranean source nor the Viking selection covered it. I added a separate medieval/early-modern highlight filter for Vasa, Mary Rose, Kronan, Gribshunden and the Bremen cog, rather than stretching the Viking category to fit.
Dates and associations need room for uncertainty
The dates needed a similar approach. For many ancient wrecks, I have a range inferred from cargo or surviving timber, not a recorded day of loss. I made the date filter check whether ranges overlap instead of reducing each record to a made-up midpoint.
For wording such as “late second century to first half of the first century BCE”, I kept the source text and used a broad whole-century envelope for filtering. Those bounds are a practical way to search the records, not statistical confidence intervals. For circa-year dates, I used the nominal year rather than inventing an error range. I also kept the Bremen cog’s date labelled as timber/construction dating, not an exact sinking year.
That leaves 49 records with unknown or unparsed dates. I kept them visible by default, with a count and an option to exclude them, rather than making them disappear when you open the map. In the date inputs, negative years mean BCE and positive years mean CE; year zero is rejected.
I was cautious with the association labels too. Roman-period groups records by time; it doesn’t establish that a crew was Roman. Greek artworks aboard Mahdia or Antikythera don’t tell me the sailors’ nationality either. I left Uluburun under Other / uncertain rather than assigning it a Phoenician or Greek identity from its diverse cargo.
Images that explain what you’re looking at
I added a contextual image to each of the 19 highlights. Finding an image wasn’t enough on its own: a preserved hull, a reconstruction, recovered cargo and a historical illustration tell different stories. I kept those distinctions in the captions.
One early choice showed architectural columns recovered from the Mahdia wreck. They really were cargo, but a room of pillars wasn’t a helpful visual introduction to a ship. I replaced it with an explicitly identified reconstruction model at the Bardo Museum.
The Nemi images needed a licence check. The English Wikipedia lead image of the hull from 1930 has unconfirmed US copyright status, so I left it out. I used a different photograph from 1929, also shown in the article and marked public domain on Commons.
I applied the sepia treatment with CSS rather than baking it into the local JPEGs. The “view unfiltered” link opens each resized image in its original colours. A brown tint doesn’t turn a modern museum photograph into a historical one, and I wanted the original appearance to stay accessible. Each image retains its creator credit, source link and licence, including the different Creative Commons versions and public-domain notices.
A chart to use, not just a tall poster
The first layout put the image, register and record details into one long column beside the map. It looked reasonable as a full-page screenshot, but made clicking around awkward: the controls and the picture could end up far apart on screen.
I changed it into a horizontal dashboard: map on the left, paginated register in the middle, and image/details on the right. Long details can scroll within their panel while the register remains available. Selecting another record returns the inspector to its image. Smaller screens stack the panels instead of shrinking all the text.
I used D3 to render the map as SVG with a spherical Mercator projection. Where numbered highlight badges would overlap, a short collision simulation separates them and then stops. Leader lines connect the displaced badges back to the reported source positions. They don’t describe sailing routes or change the archaeological coordinates.
For the blog embed, I sized the dashboard from its width rather than the iframe’s height. Using height in both directions would create a loop: measuring the contents changes the iframe, which changes the size of the contents being measured.
Sources and a local snapshot
I bundled the visualization with this post, including its data, libraries and photographs. Opening it doesn’t query a live wreck database or request tiles and images from third-party servers.
- Archaeological background: EMODnet’s cultural-heritage shipwreck product, CC BY 4.0. Downloaded from the EMODnet Portal; data originator AND-International. Original archaeological provider: University of Oxford, Oxford Roman Economy Project; Strauss (2013), Shipwrecks Database v1.0. The Mary Rose coordinate comes from Historic England through the same licensed product.
- Reviewed coordinates: Wikidata structured data, CC0, apart from the separately credited Mary Rose coordinate. I summarized the linked museum and archaeological histories for the annotations rather than bundling their article text.
- Coastlines: Natural Earth, public domain.
- Images: individual Commons file licences and credits, retained next to each image and in the image notes.
- Renderer: locally bundled D3 4.13.0, BSD-3-Clause; plain HTML, CSS and JavaScript.
I used the explicitly licensed EMODnet distribution rather than republishing Oxford’s separately downloadable 2017 spreadsheet, whose redistribution terms weren’t verified.
Downloads and notes: all 346 records, method and limitations, EMODnet provenance and blog snapshot manifest. The challenge repository contains the preparation scripts.
The vintage styling was the starting point. Working out what each marker actually represents became the more interesting part: a voyage cut short, a vessel deliberately sacrificed, a burial, or timber that survived long enough to be found again.
I used Pi Coding Agent with gpt-6.1-sol for source and licence research, data preparation, implementation, writing assistance and checks.