About me
Hey, I'm Walter M. Rafelsberger and I work as a software engineer with the data visualization team at Elastic.
I'm a self-taught interdisciplinarian. Among single-topic experts, I quickly fall into imposter syndrome, so I put together this page to occasionally remind myself of my strengths and what I've achieved along the way. That said, while this is all about me, none of it happened in isolation — I've had great mentors who gave me chances (some even hired me on the spot), and I've been privileged to work with amazingly talented colleagues throughout. So here's a bit more of my background, enjoy the ride!
From 1998 to 2002 I studied MultiMediaArt at the University of Applied Sciences Salzburg. The program had a curriculum that spanned various fields such as design, technology and even some semiotics and philosophy. To be fair that sounds a bit fancier than it was, but it sparked the right interests in me and gave me some good pointers for my future career.
In the early 2000s, I got the chance to work for a few years as Visual Effects Supervisor on a certain animated short film that made it to the Cannes Film Festival and went on to win 35 international awards. Working on that found footage film was a movie buff's dream come true.
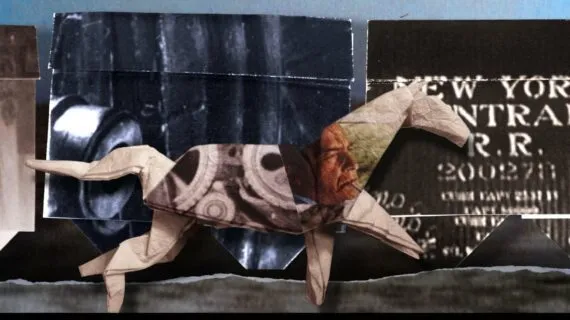

Movie stills from animated short film Fast Film
After that followed an actual MultiMedia phase with projects spanning websites, videos, vjing, multi-media installations and of course, why not, CD-ROMs. I contributed to some projects that took home the National Award for Multimedia & E-Business in Austria (video installations for the Austrian Parliament and Mozarthaus Vienna). During that time I also was part of Austria's Diagonale Film Festival team and put my organizational skills to use with logistics coordination and internal communications.
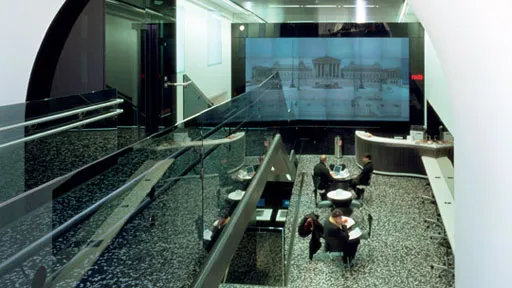
Video wall at the visitor center at the Austrian Parliament
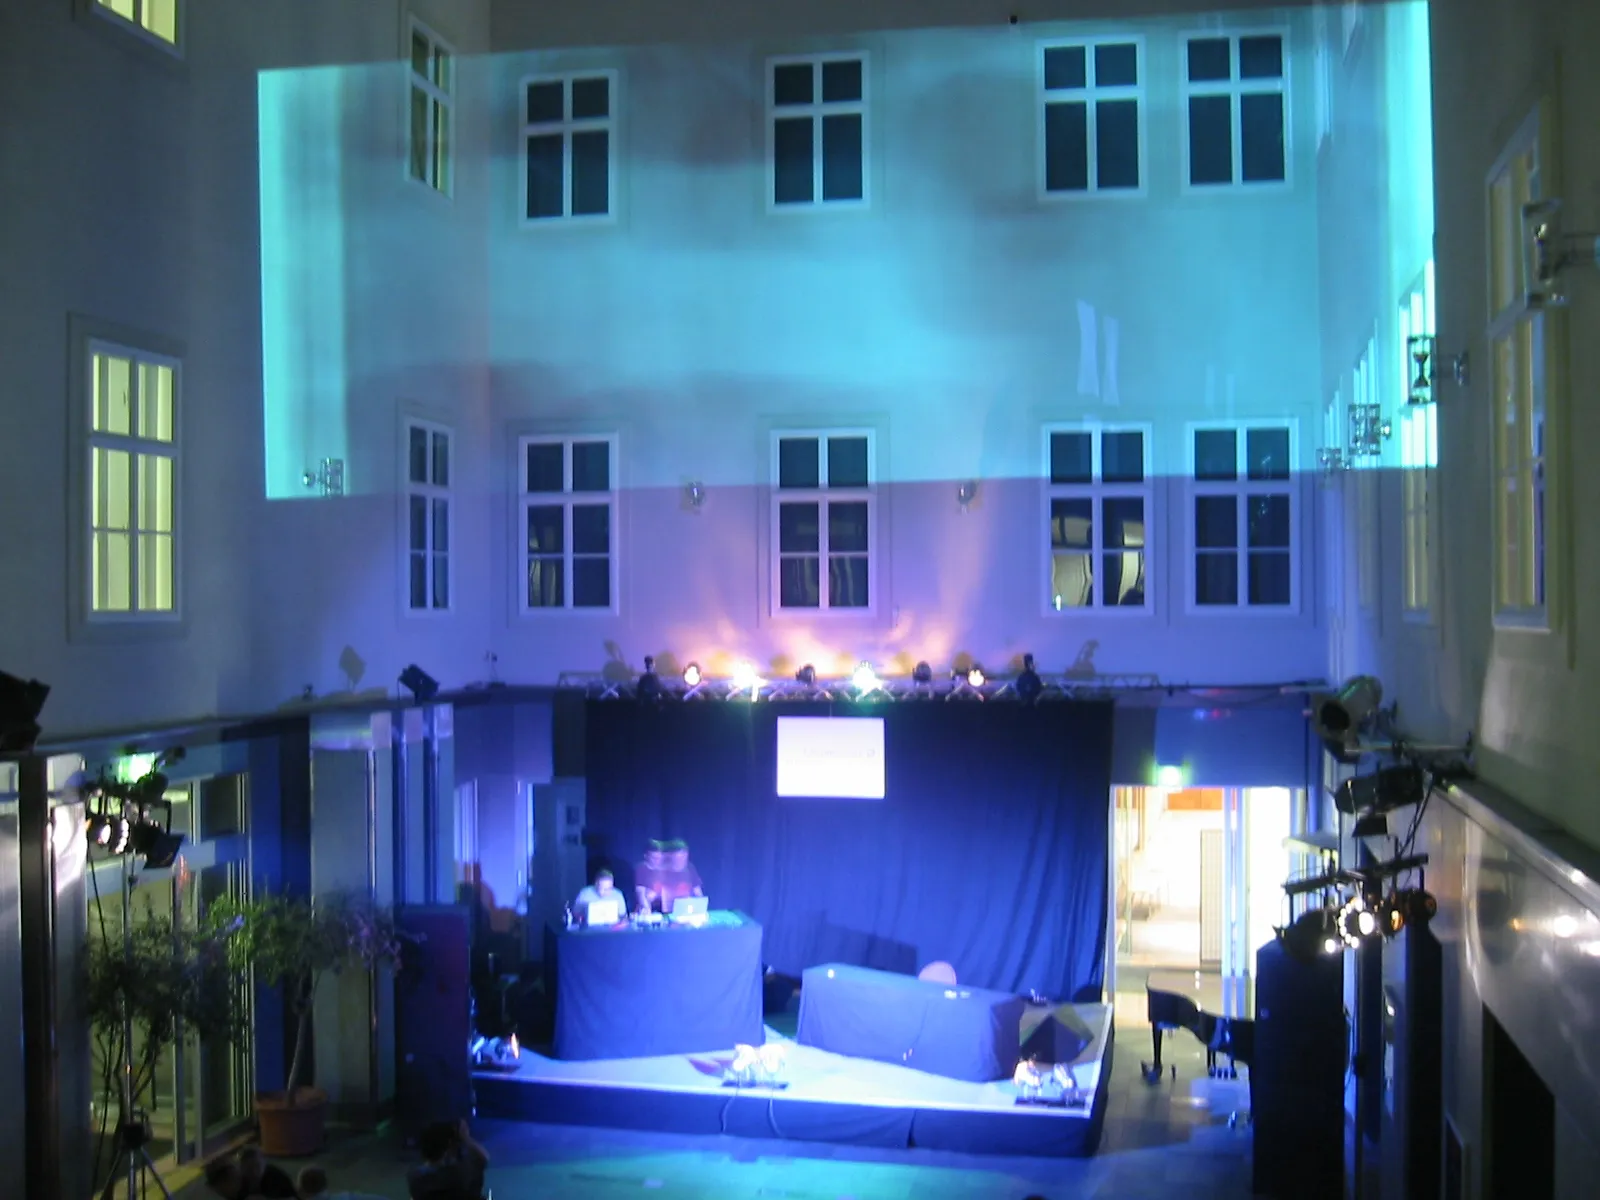
My VJ alter ego in action: marod visuals at Haus der Musik Vienna
During this period, my portfolio also grew to include some data visualization side projects mostly sparked by cross-reading Deleuze with NLP techniques (analysing wikis, news articles, movies etc.). Eventually, this became my entry point into more researchy and techy roles.
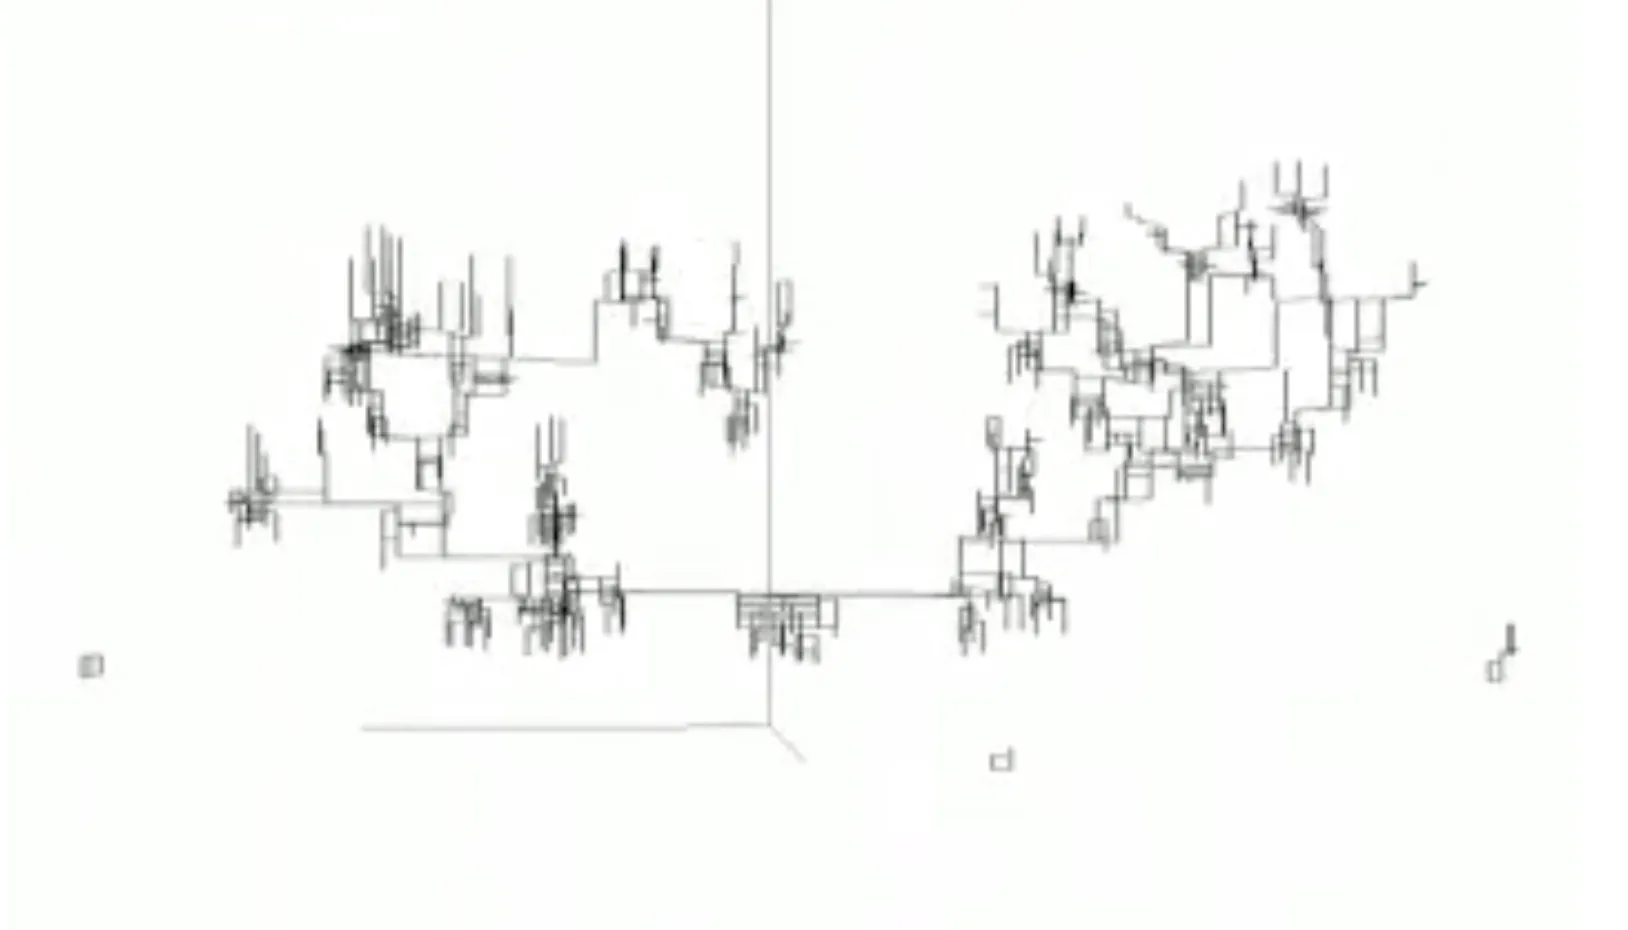
Islendigabok genealogy visualization
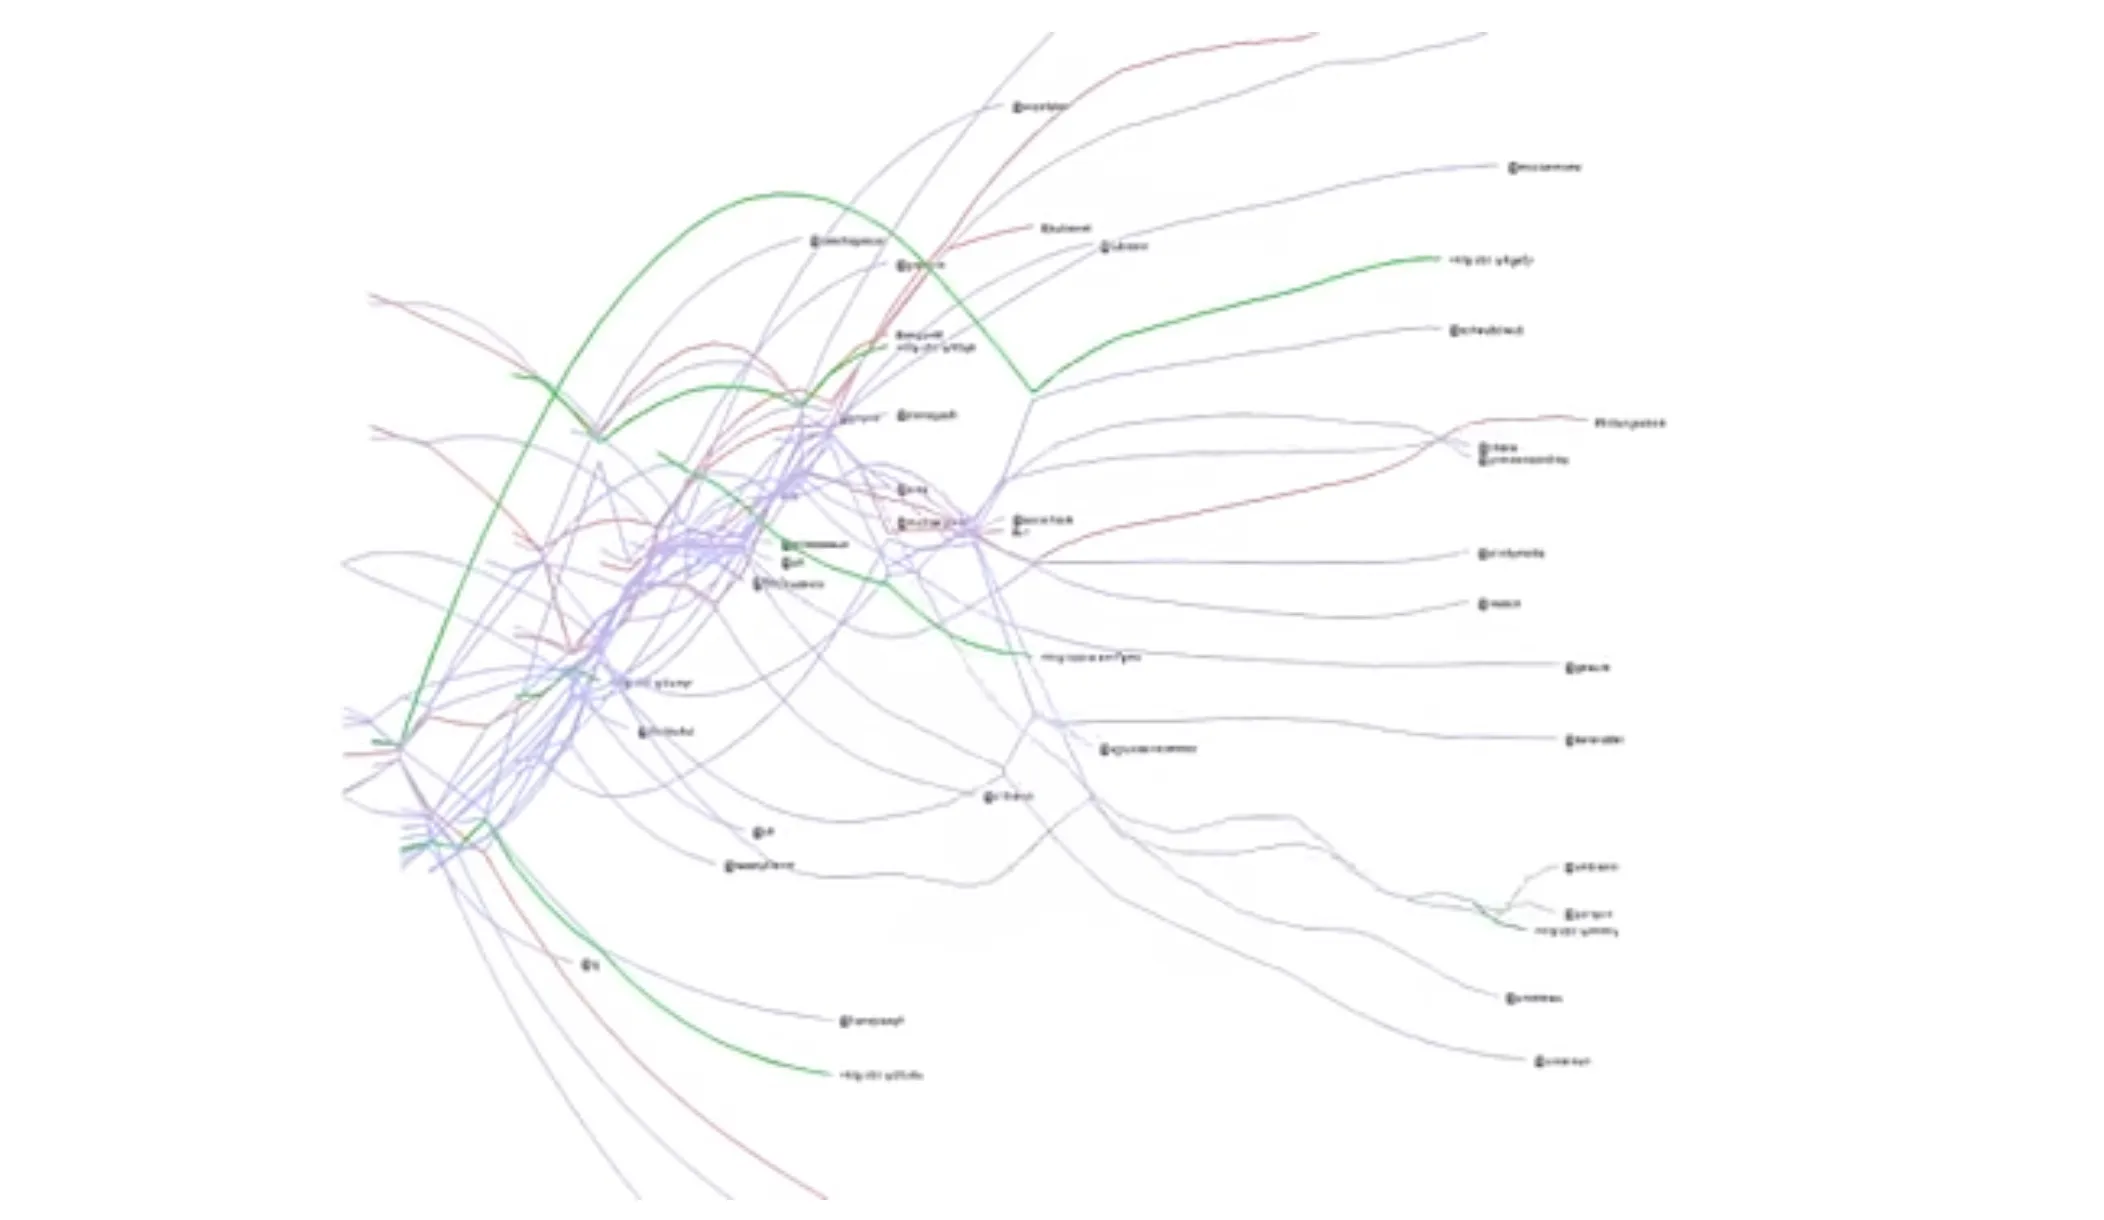
#unibrennt twitter conversations
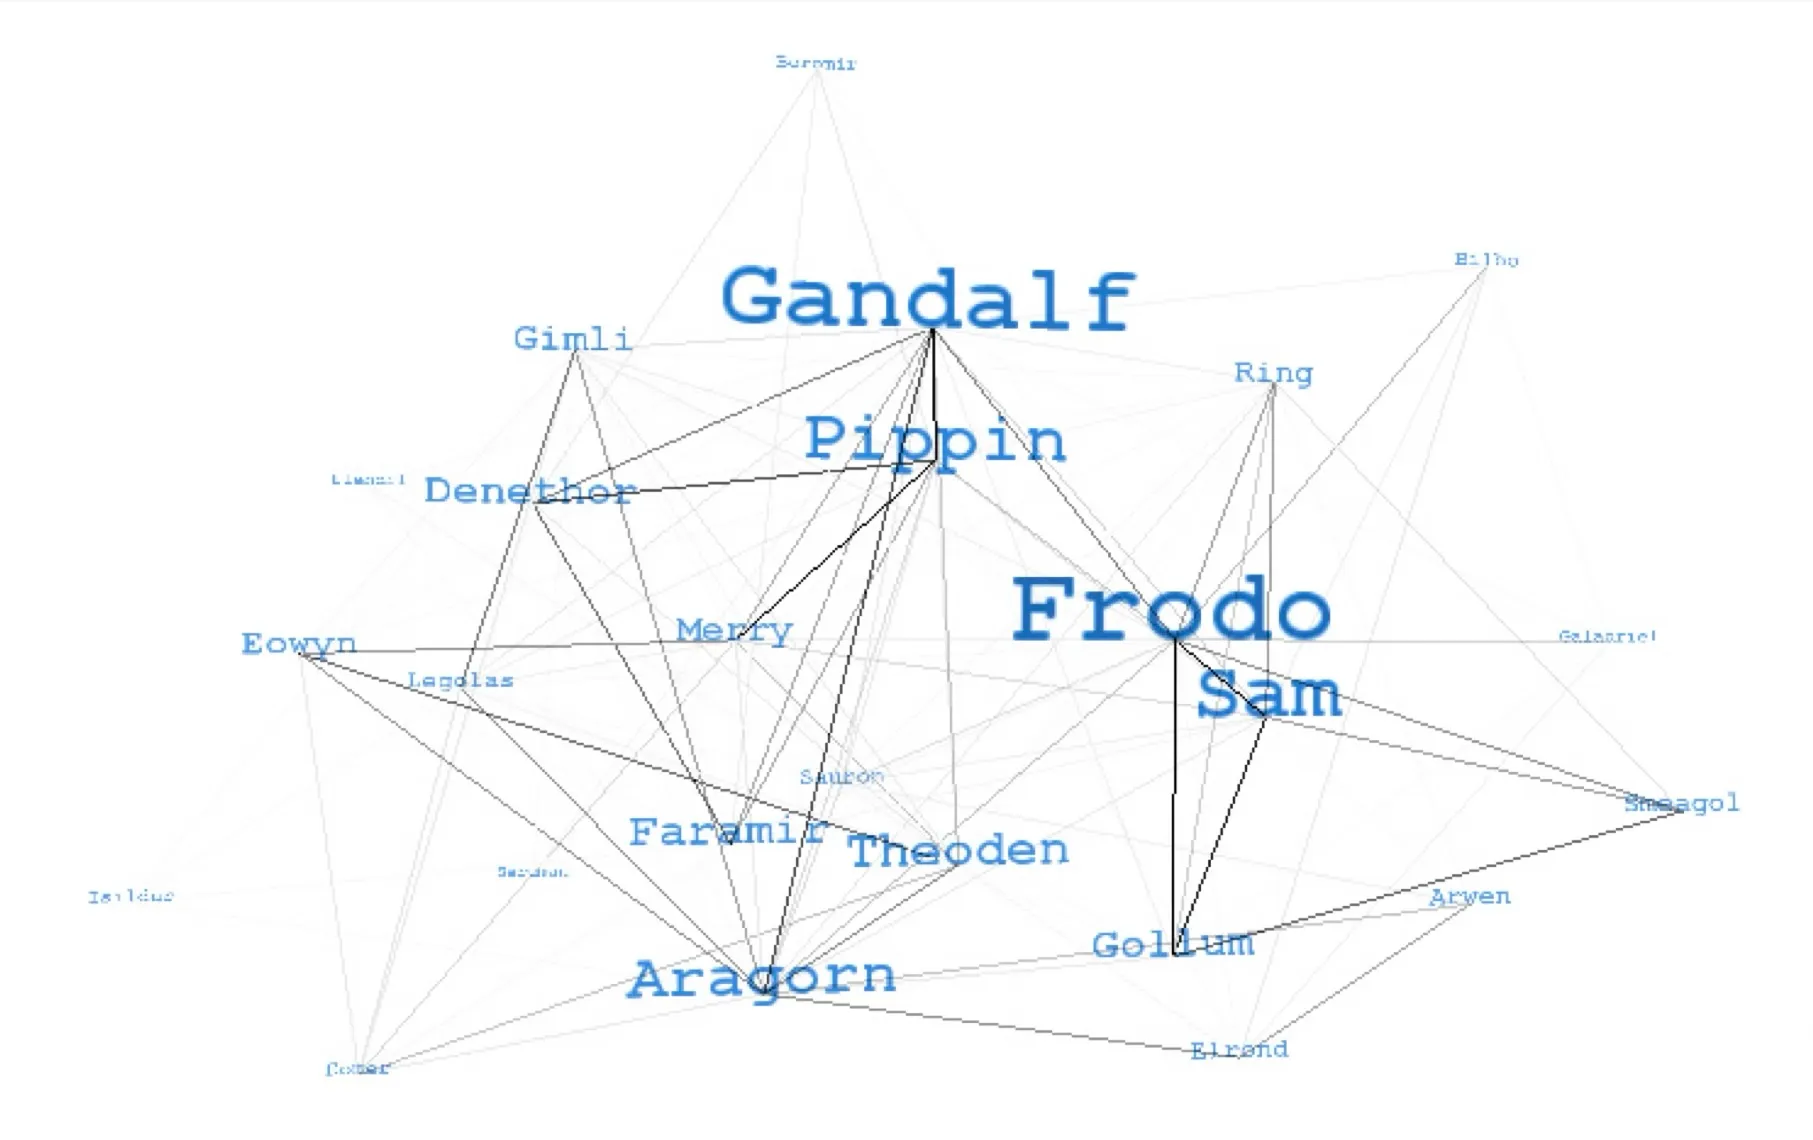
Lord of the Rings social network analysis
So from 2007 onwards, my career became more focused and my work consisted more and more of web-based data visualization projects. This included roles as a researcher at the Vienna University of Economics and Business, MODUL University Vienna, and academic spinoff webLyzard where I ended up as lead data visualization engineer. I was part of a great team that built a social media analytics platform used, for example, by the United Nations, NOAA and BMW Group. I also did an intermezzo as a co-founder and CTO of a small startup doing social media analytics.
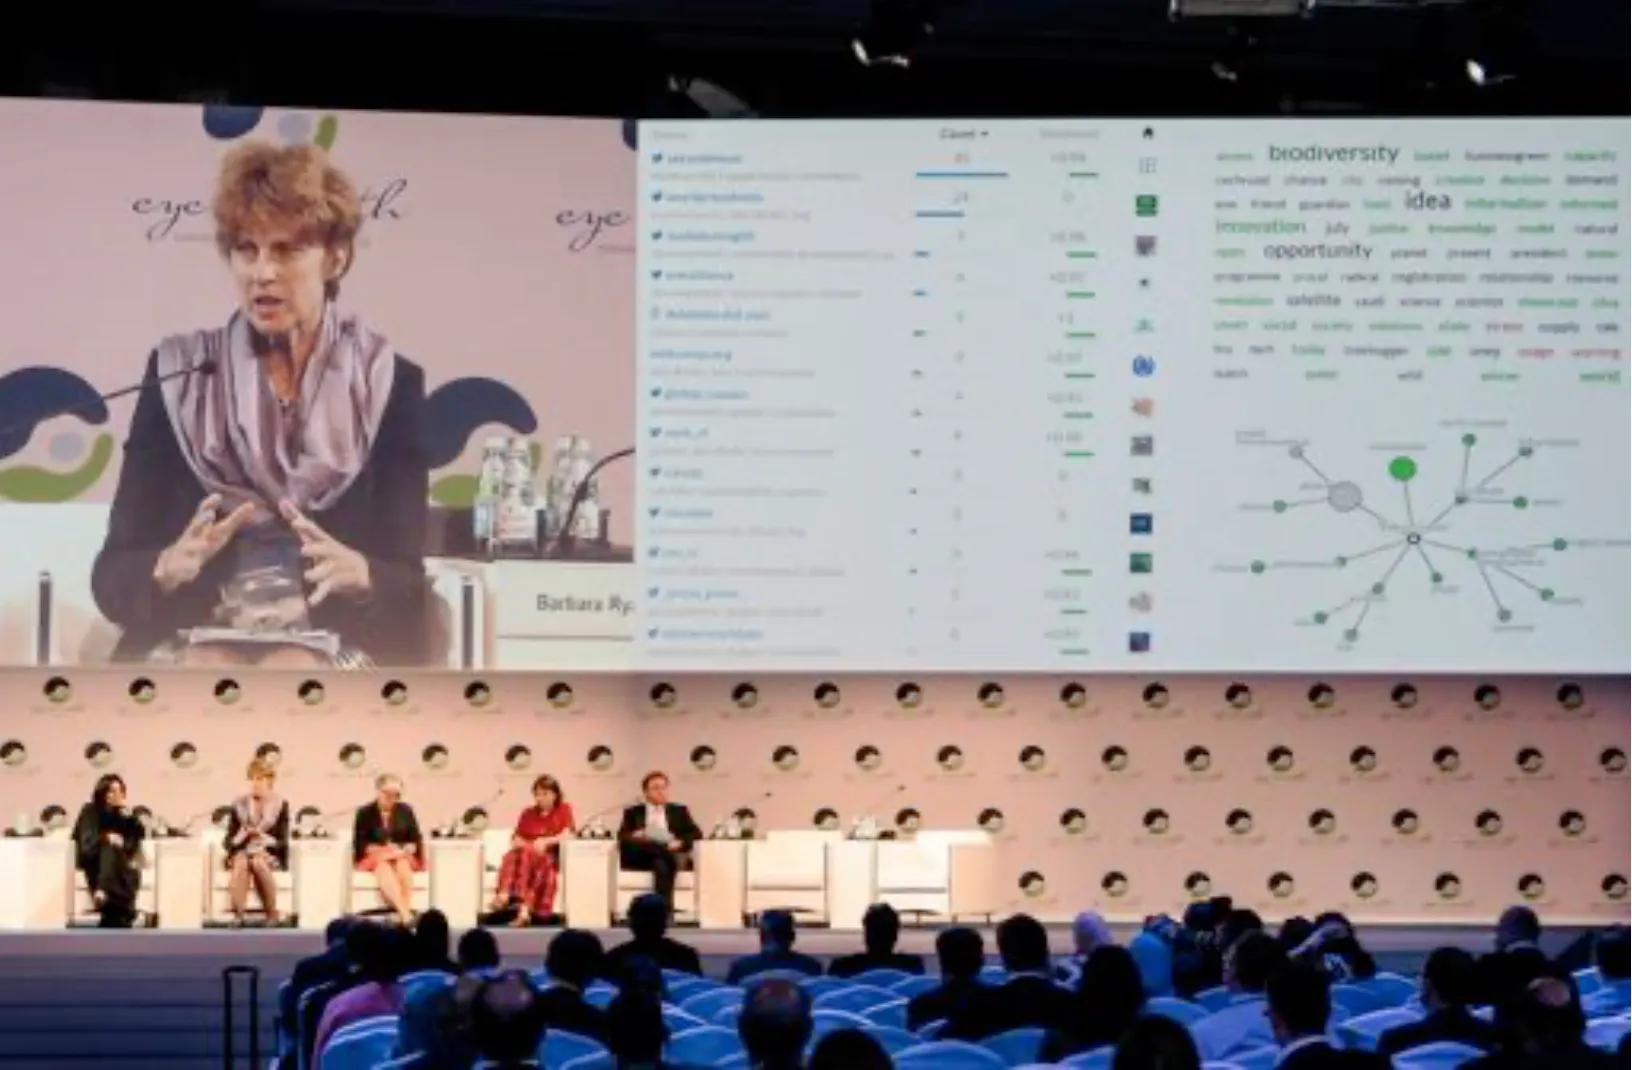
Presentation of Media Watch on Climate Change based Visualizations at Eye On Earth 2015
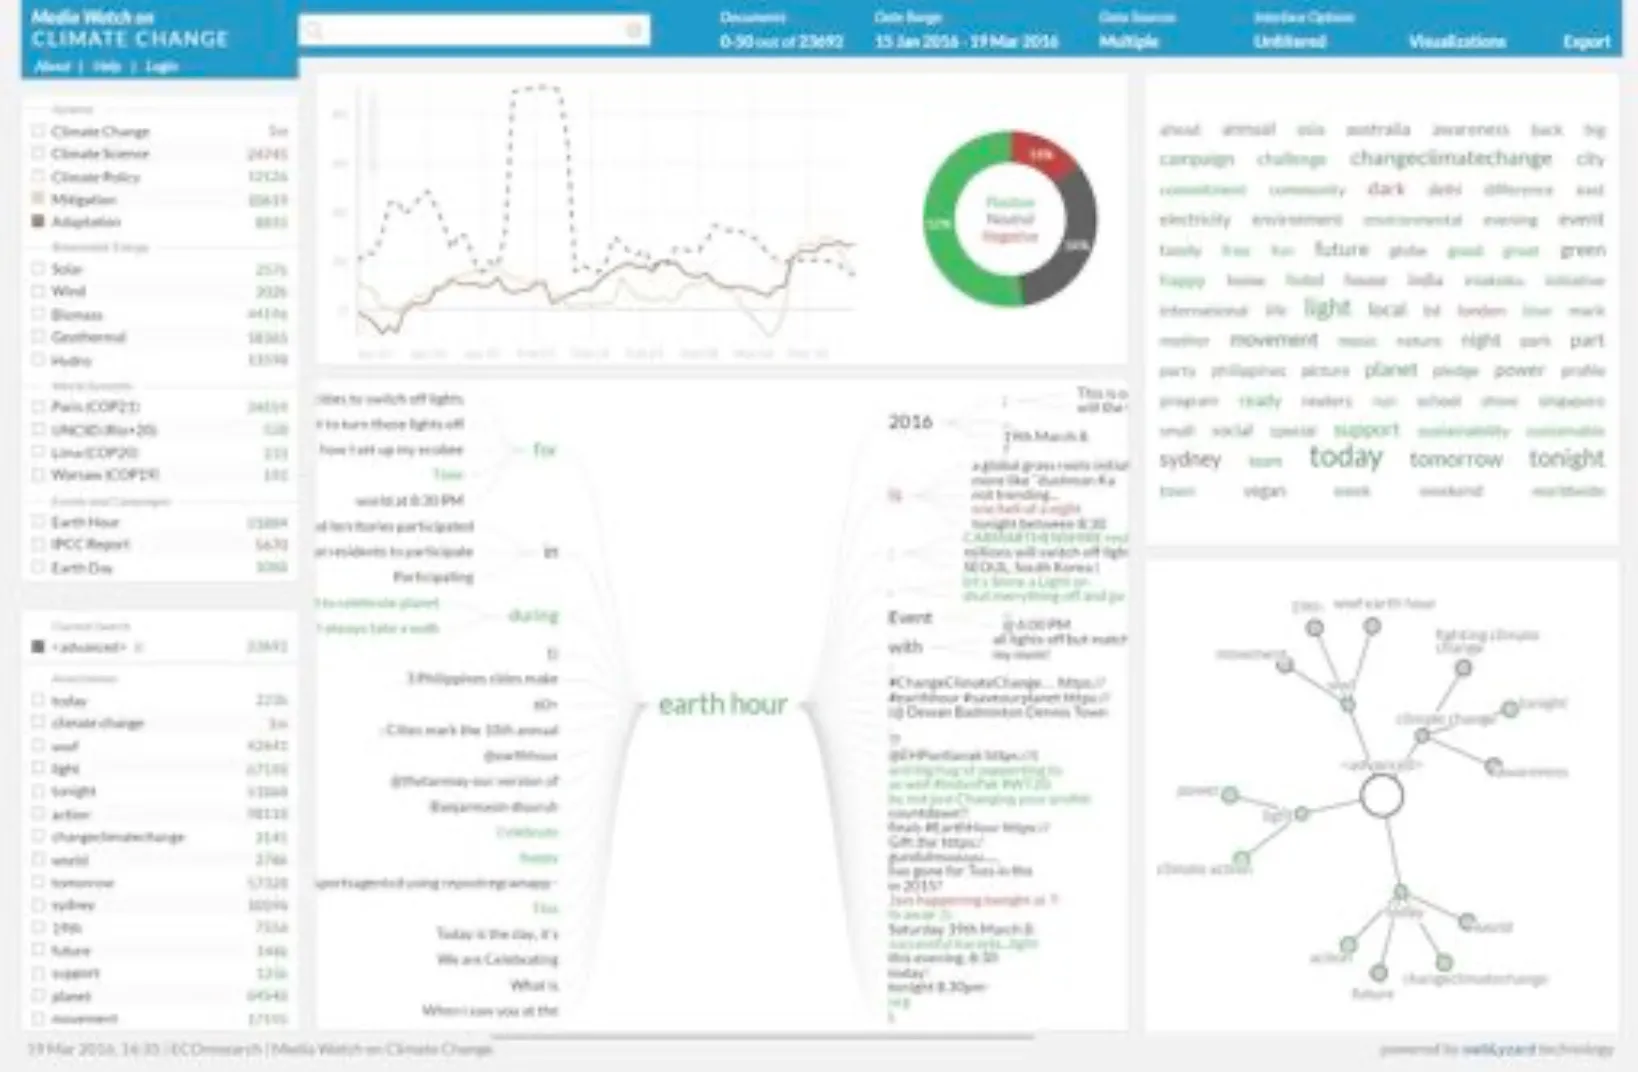
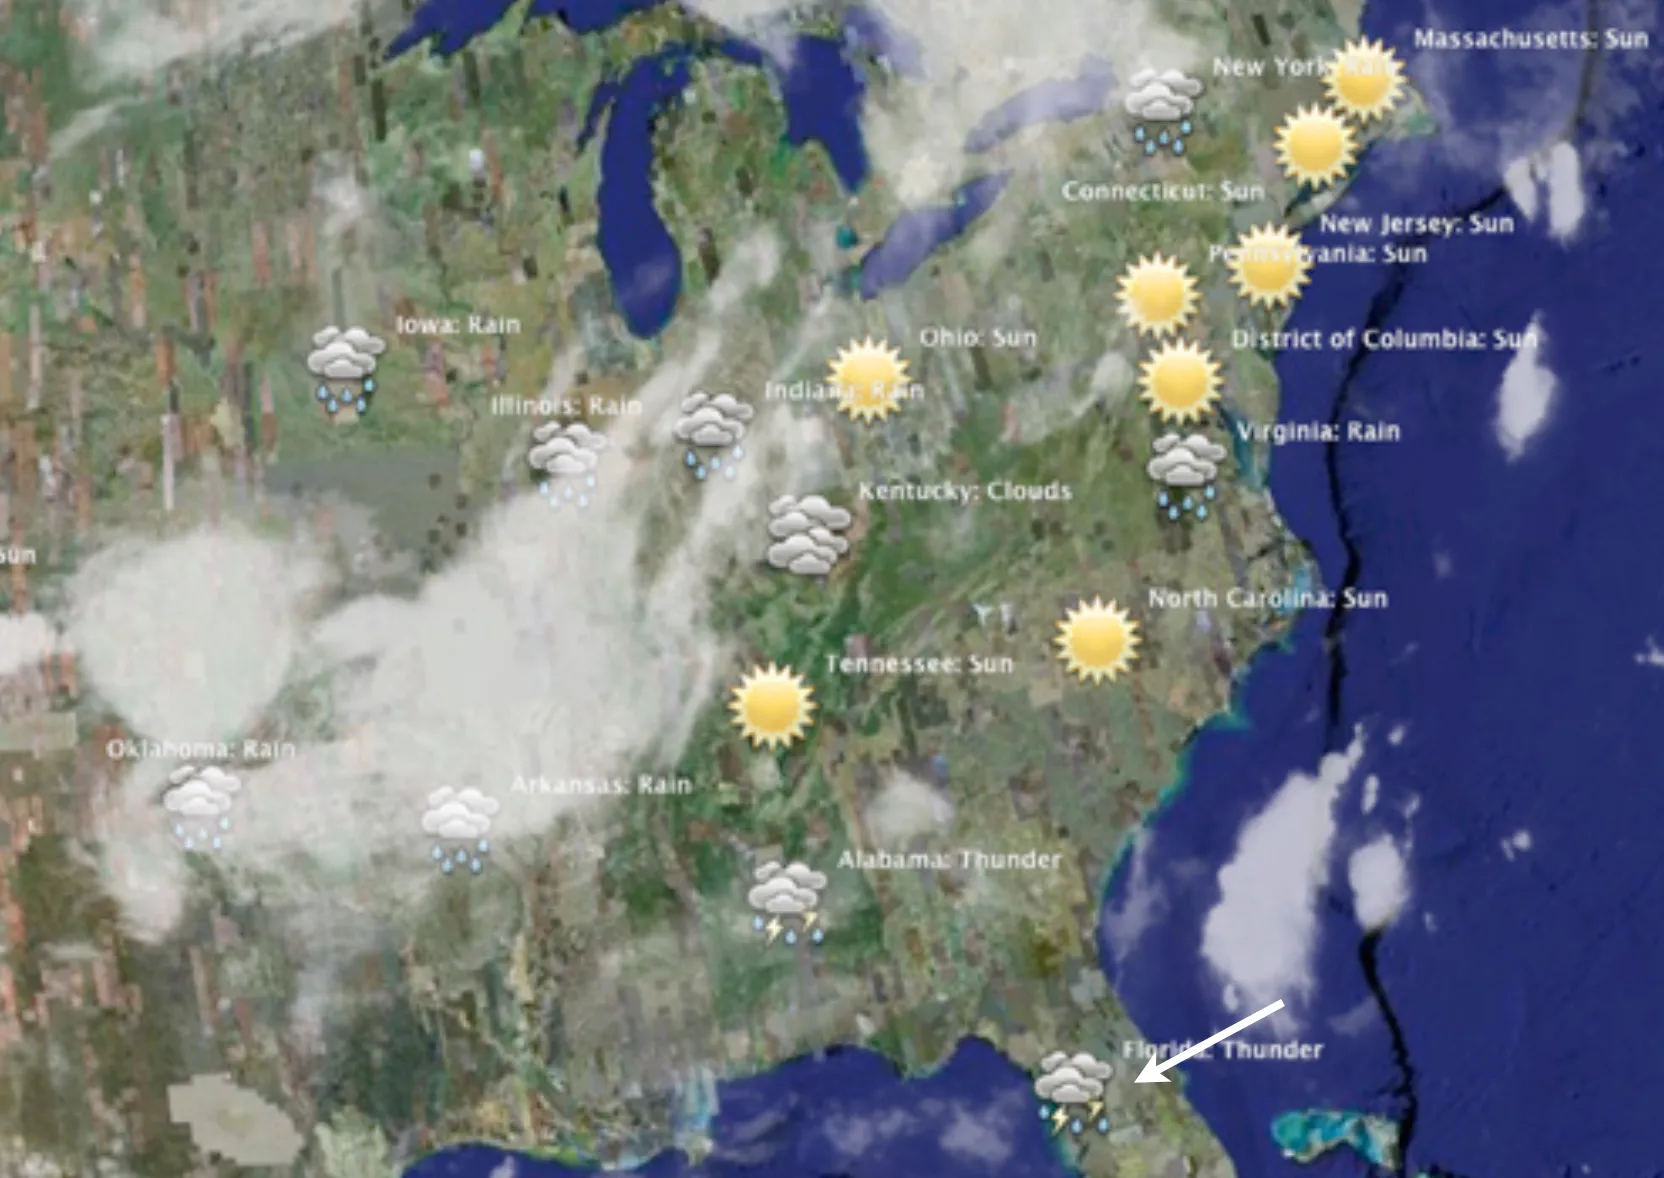
Visual Analytics Dashboard for Earth Hour 2016 Global Coverage
As my career progressed, I also gained some experience as a speaker at conferences and meetups. One early highlight in that regard was in 2011 when I was a pre-speaker for Austria's most popular news anchor Armin Wolf, where I shared some examples of my work on social media analytics in front of a crowd of ~300 people.
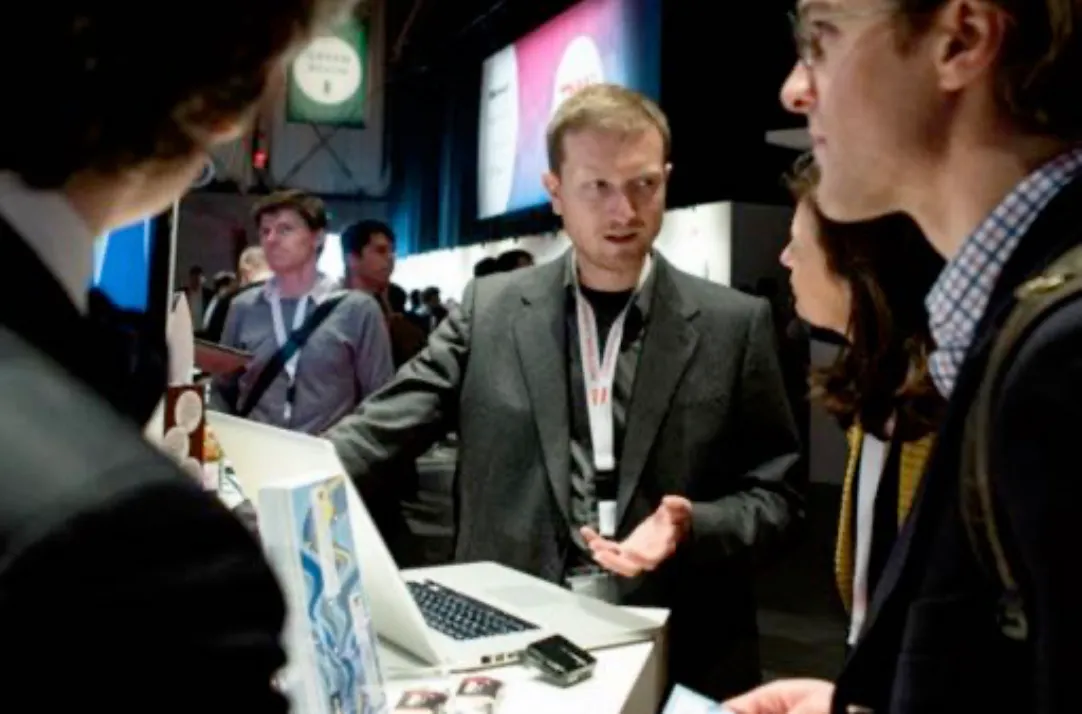
Me at our booth in Amsterdam at The Next Web Conference 2012 trying to convince folks that social media analytics is awesome.
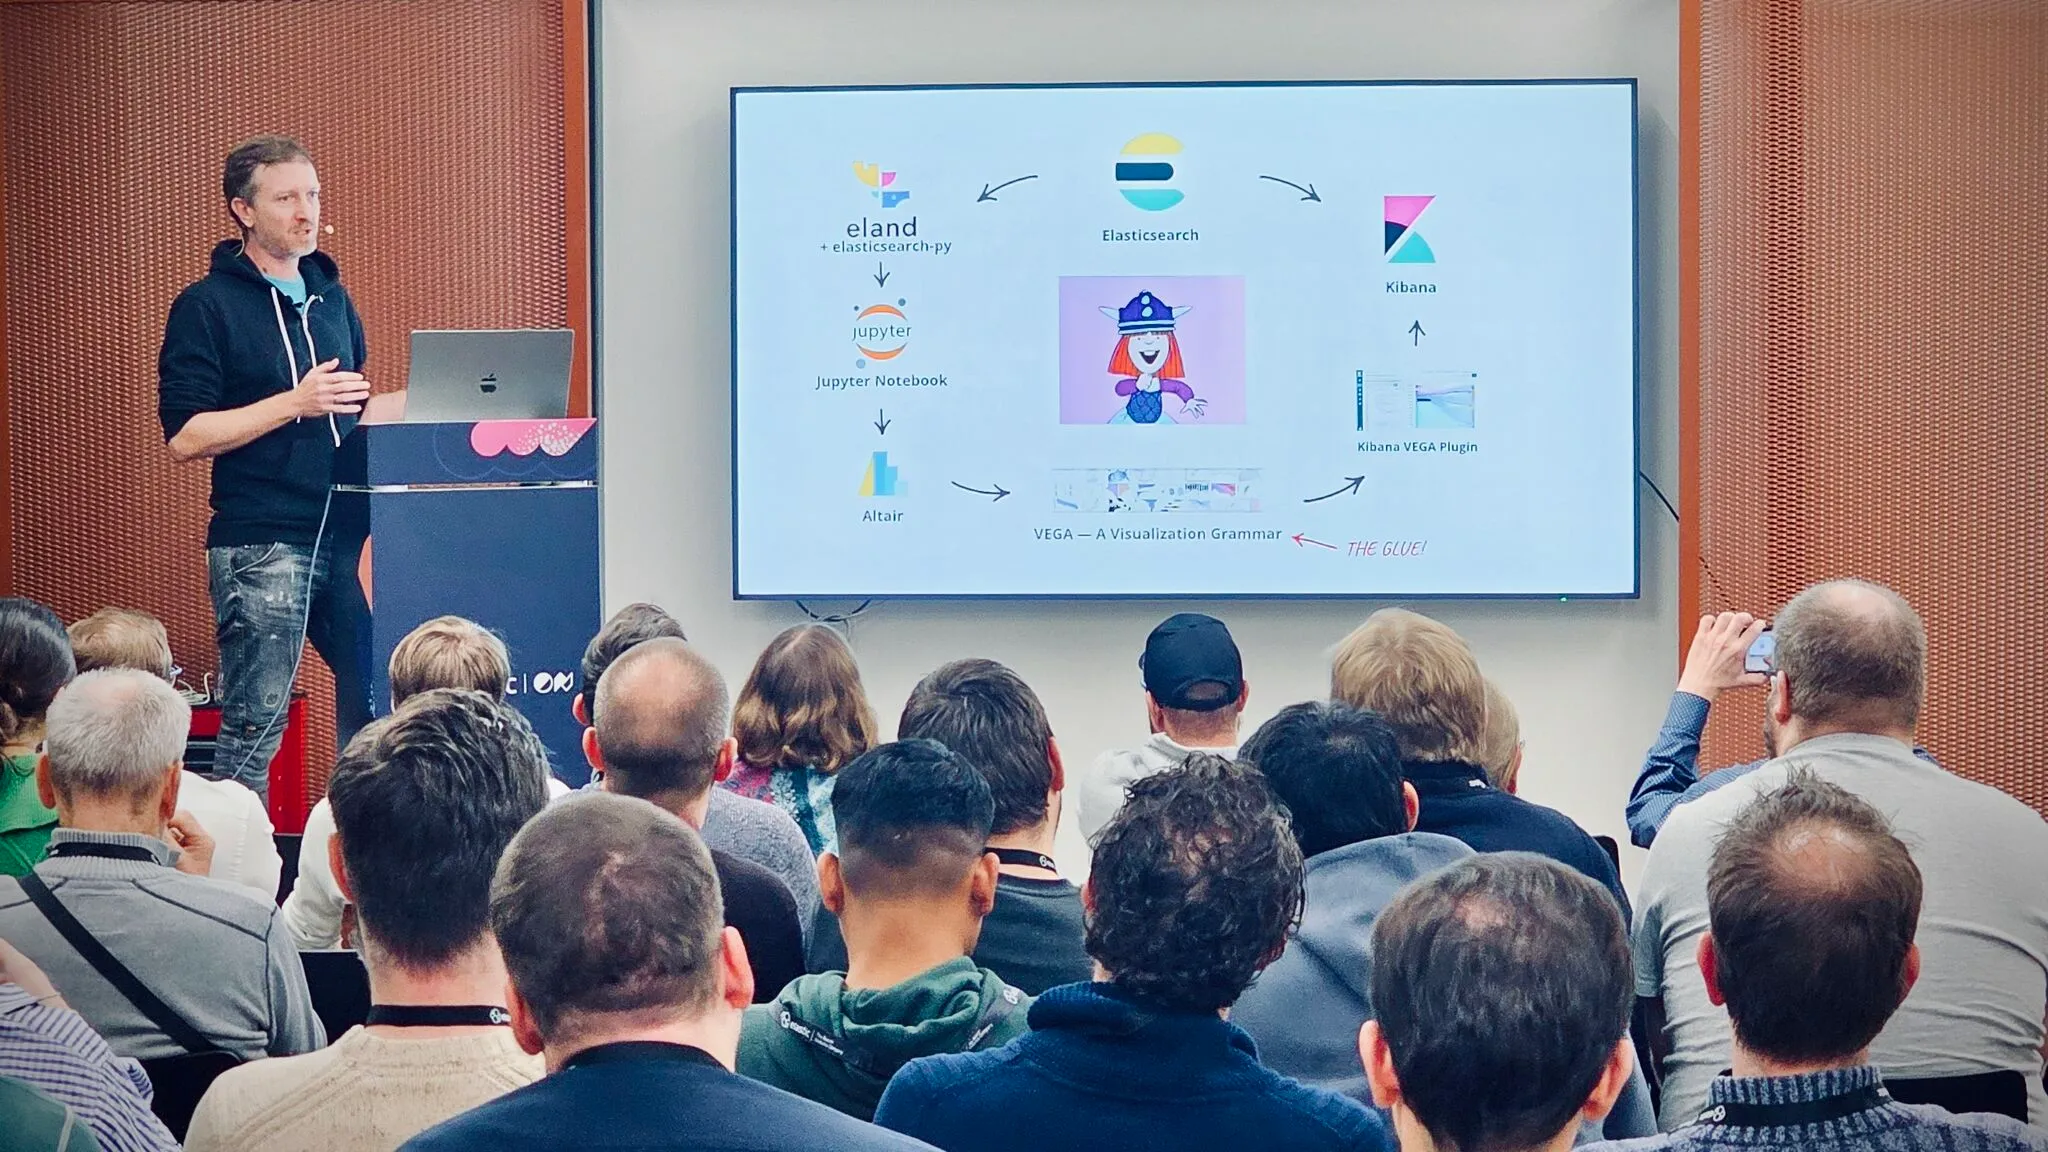
Me more than 10 years later at ElasticON Munich explaining to folks how awesome data science workflows are.
For almost 10 years I was a guest lecturer at the University of Applied Sciences Kufstein where I taught introductory courses on data visualization and web technologies. For a few years I even did a more advanced course there named Visual Analytics for Data Science for Master's students.
In 2017, I joined Elastic as a UI engineer on the Machine Learning team. Since then, I've contributed to UIs for running and analysing ML classics like anomaly detection, outlier detection, classification and regression. I built the first iteration and maintained for a while the UI to manage transforms, an Elasticsearch framework to progressively persist pivots and aggregations as new indices. In 2025 I transitioned into the data visualization team at Elastic where I now work on the Elastic Charts library and its integration into Kibana's dashboards and product solutions.
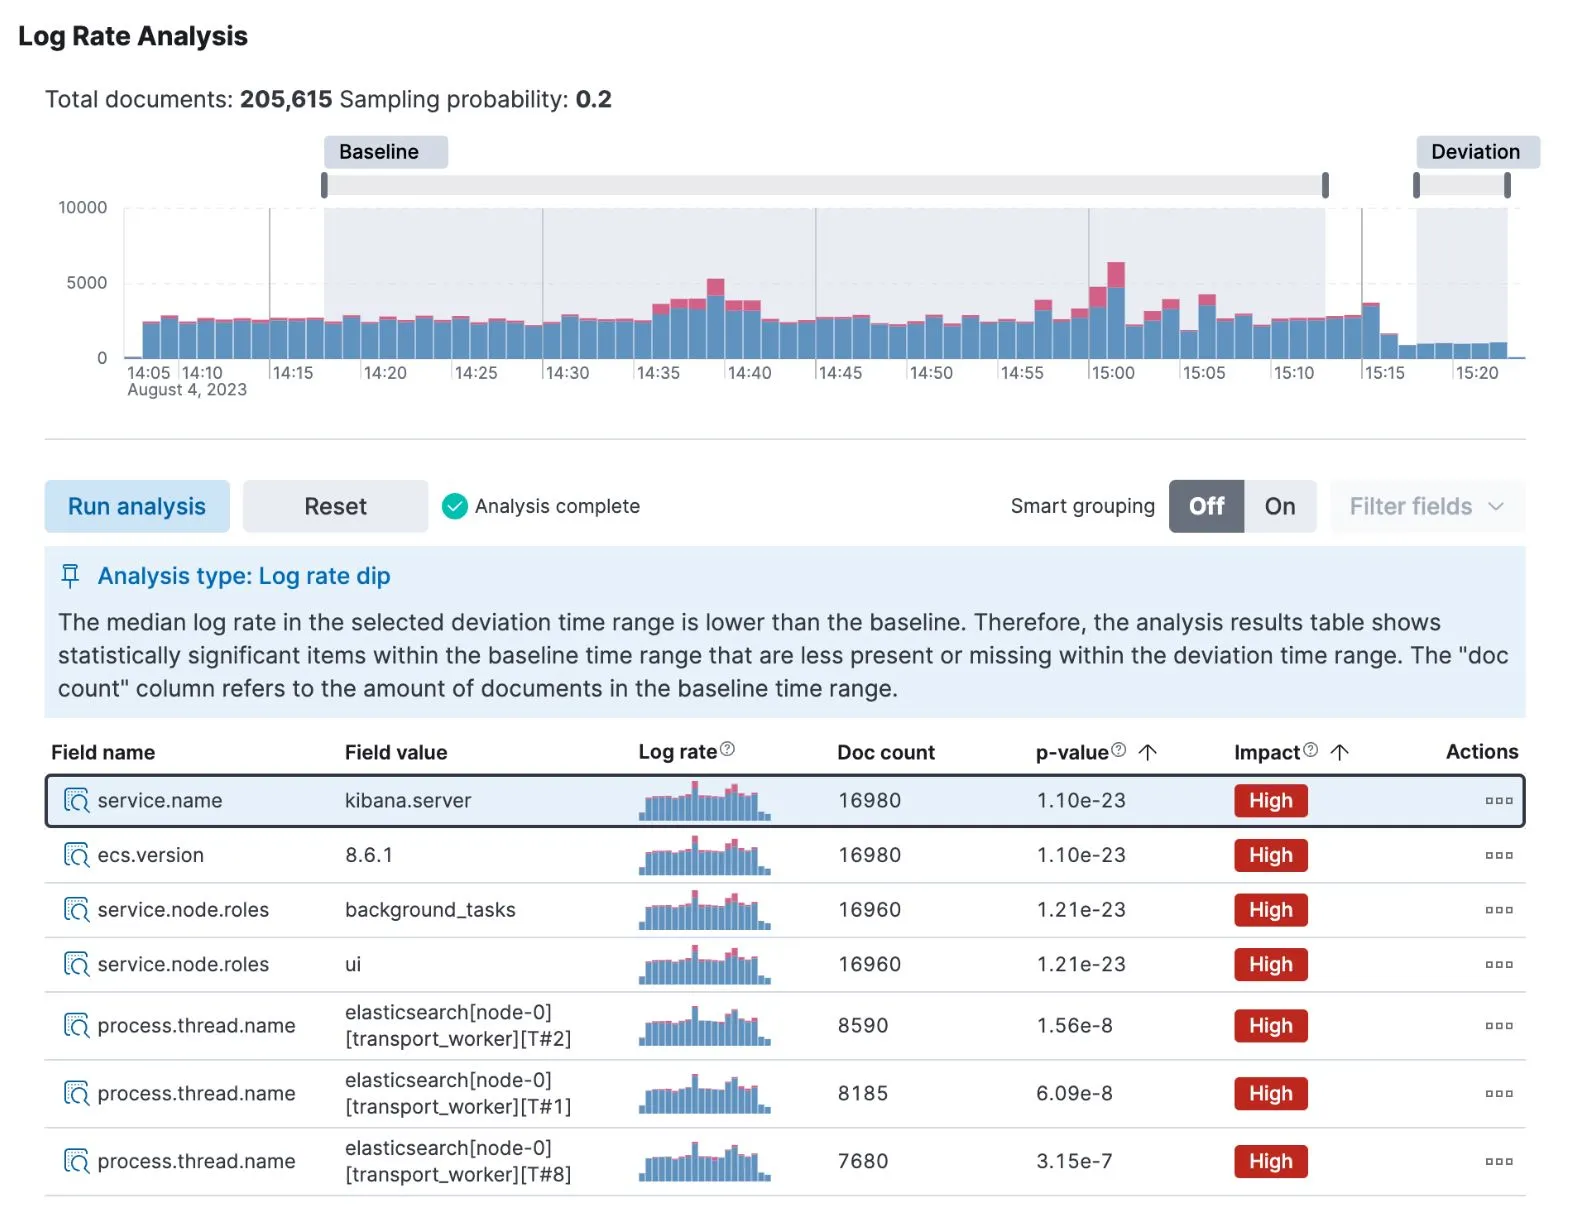
One of the AIOps features I built for Kibana
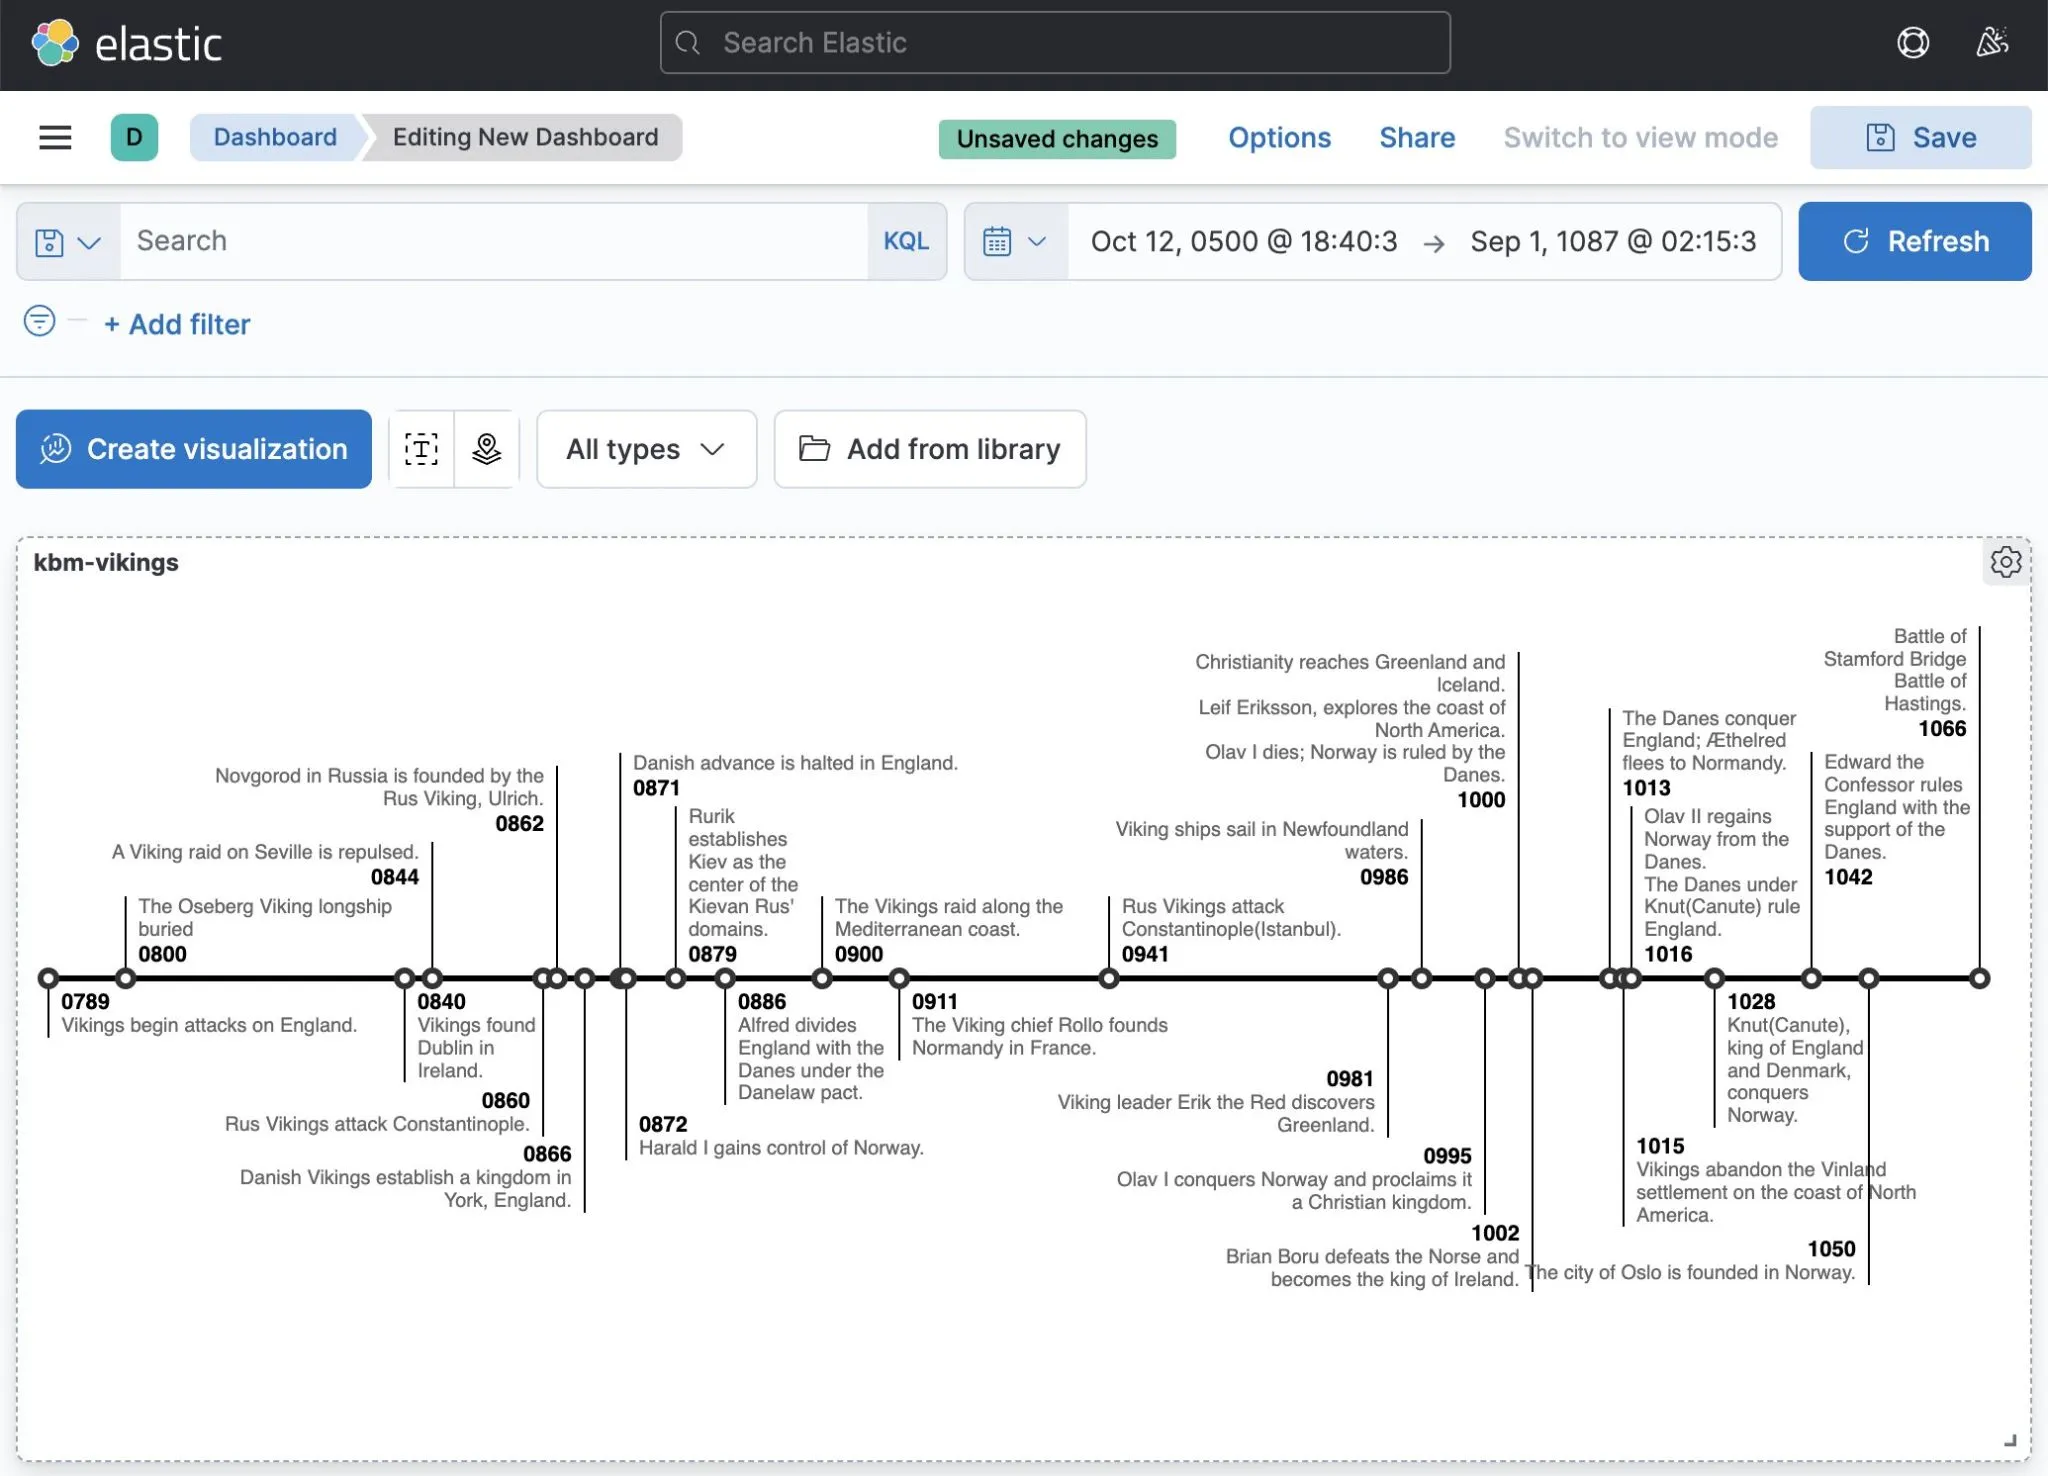
Milestones visualization plugin for Kibana
Let me close by saying that the above is the happy-path version. I've had my ups and downs. My fair share of bumpy roads and heavy winds in my early career. When I was self-employed I struggled with finding clients and steady income. On the other hand I overcommitted and crunch times led into multi-month burnout twice. Turns out there are ways to cope with this and get more resilient. Short version that worked for me: Accept all the support you can get from close family and friends to be able to fully step back from the environment that caused the burnout. Do some therapy. Then aim for an environment that reduces the social pressure and factors that led to the burnout in the first place. Continue with some more therapy. I admit I was privileged to have the support of family and friends and was able to afford therapy, all of that is not available to everyone. I hope this transparency may help others a bit who are in a similar situation. Reach out if you just want to talk. Luckily, these experiences lie now almost 15 years behind me. After all, I'm still around, doing what I love.