code
github.com/walterra/d3-milestones
A d3 based timeline visualization. It's also available as a Kibana plugin (kibana-milestones-vis) as well as wrapped in a React component (react-milestones-vis).

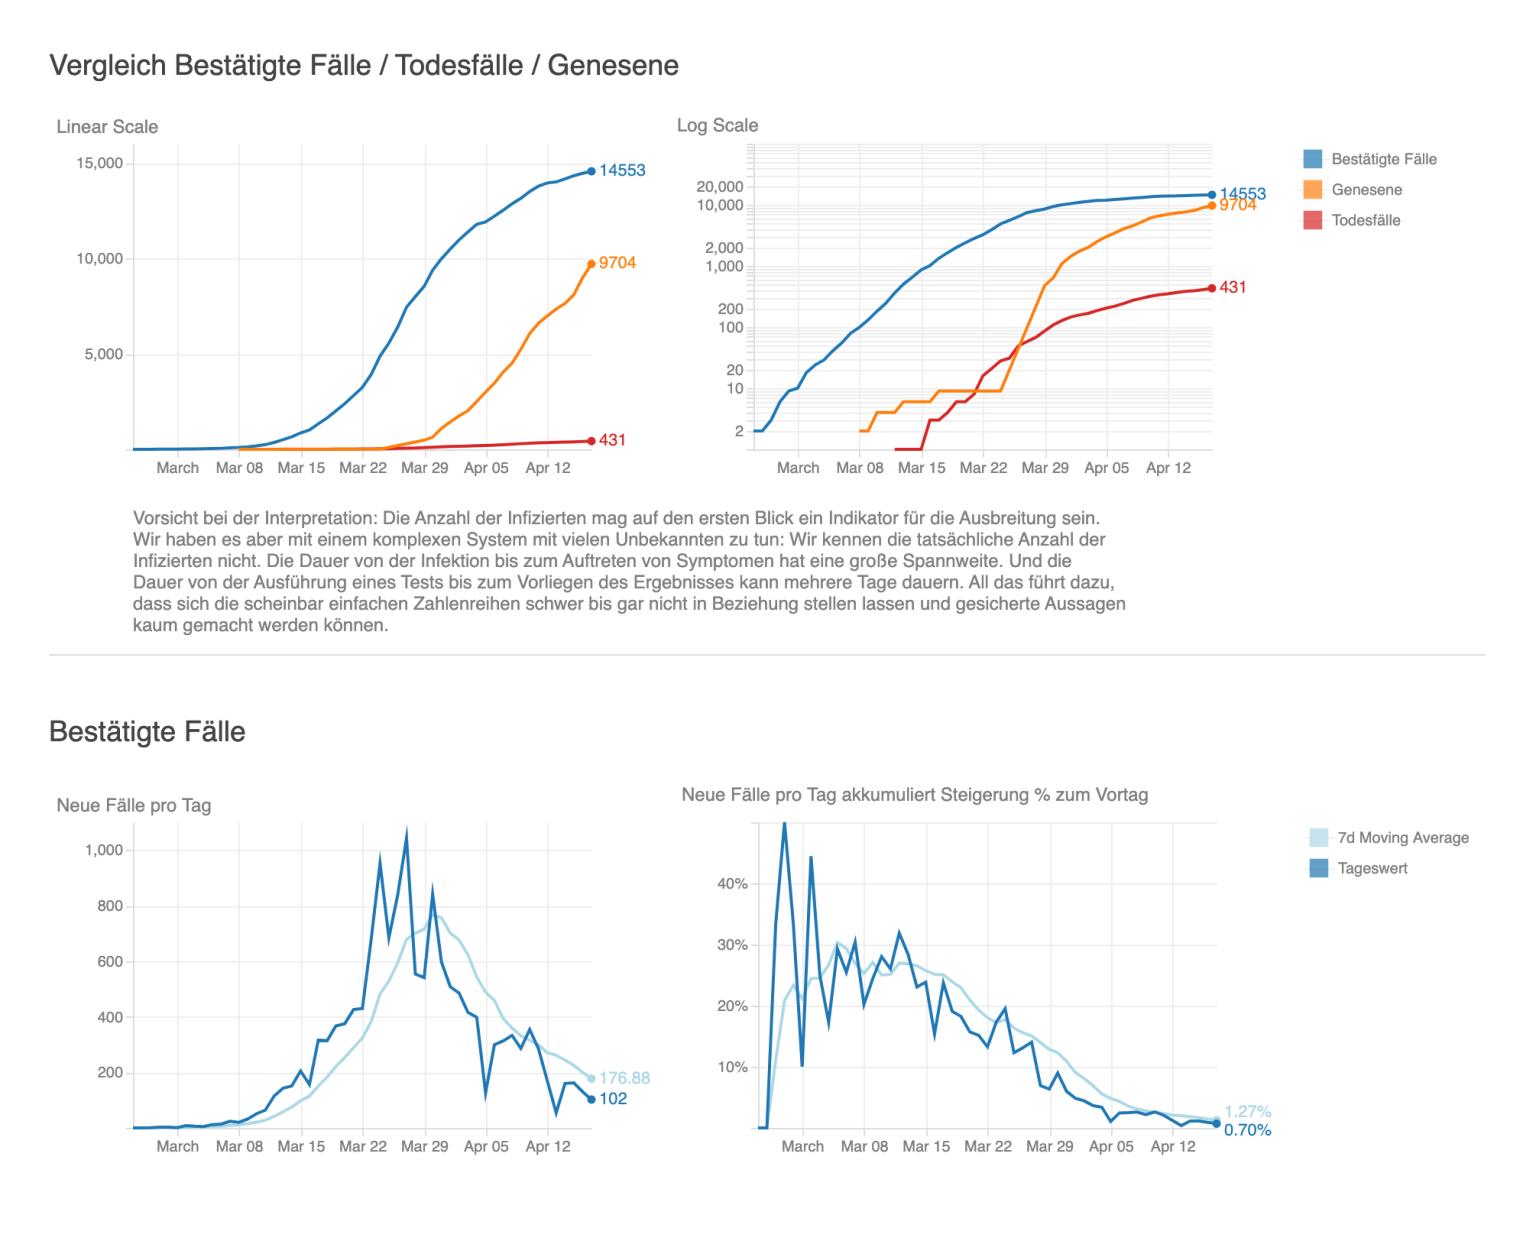
walterra.github.io/covid-19/
In the beginning of the COVID-19 pandemic, esp. compared to Italy, officials in Austria struggled to provide open data and analysis on the emerging pandemic. A lot of comminuty efforts popped up to collect and clean up available data. I documented the issues in an article on the citizen journalism blog semiosis.at. During that time I created a set of visualizations to keep track of COVID-19 in Austria. All the code to transform the source data and create the visualizations is open source. I automated it with daily updates by using a workflow with Jupyter Notebooks + Altair/VEGA to develop the charts, then rollup/babel for optimization of the JS code.
eddo
Loosely GTD inspired todo & time tracking app. The app is based on my offline/notebook based approach I've been using for 10+ years to manage daily tasks. It's done with a stack of PouchDB (=CouchDB in local storage) and React. Not very polished but served me well since late 2022.
