Qwen3.8-27B on the GX10: benchmarking a local 262K-context model and wiring SGLang metrics into the stack
/ 8 min read
Table of Contents
Yesterday I upgraded the Synology’s Elasticsearch and Kibana to 9.5.4. Today I’m putting that pipeline to actual use: benchmarking Qwen3.8-27B on the Ascent GX10 and cross-checking the numbers against live telemetry.
The model itself is Qwen3.8-27B NVFP4 with a DFlash2 drafter, served by SGLang inside Docker. It’s the successor to the Qwen3.6-35B-A3B setup on my M4 Max and the Qwen3.6-27B vLLM setup on this same GX10. SGLang replaced the AEON vLLM container because the SGLang team ships a purpose-built DFlash2 drafter image and the hasso5703/dgx-spark-qwen38 wrapper handles the whole lifecycle as a systemd-managed Docker container.
The model runs with a native 262K context, a 0.50 static memory fraction, and a 100 GB container memory limit. No YaRN, no context extension. The Bearer key lives at ~/.config/qwen38/api-key on the box.
Wiring up the telemetry pipeline
With the Elasticsearch 9.5.4 upgrade on the Synology out of the way, the next step was getting the GX10 actually talking to it. I installed the Elastic Agent in OpenTelemetry Collector mode (the elastic-agent-otel systemd service, ARM64 build) on the GX10. The collector scrapes three sources and ships them over OTLP to Elasticsearch on the Synology:
- SGLang Prometheus metrics — scraped every 10 seconds from
http://127.0.0.1:30000/metrics. This gives megen_throughput,spec_accept_rate,cache_hit_rate, KV token counts, and context length. I had to add a pipeline transform to convert SGLang’s cumulative counters into delta temporality, because Elasticsearch’s OTel exporter rejects unhandled cumulative metrics. One quirk:sglang:fwd_occupancyreports NaN/Inf when idle, so I drop that series before it reaches Elasticsearch. - GPU telemetry — a small Python script (
nvidia-gpu-exporter.py) that shells out tonvidia-smiand exposes Prometheus metrics on127.0.0.1:9400. It reports GPU utilization, temperature, and power draw. GPU memory values are intentionally absent —nvidia-smireports them as[N/A]on the GB10’s unified-memory architecture, which is a bit of a gotcha. - A five-minute canary probe — a systemd timer fires a real non-streaming generation request through the keepalive proxy, asks for “OK”, permits 8 completion tokens, and discards the response. It publishes
qwen38_canary_up, latency, and token counts. If the model is down, the probe exits nonzero and the canary metric drops to 0.
The agent config lives at /etc/elastic-agent-otel/otel.yml, credentials in a mode-0600 env file. The whole thing is about 80 lines of YAML plus the one-line GPU exporter script. Once it was running, I created a Kibana dashboard with 11 panels — canary health, latency, GPU temp/power, host CPU/RAM, generation throughput, request queue, and cache/speculative-acceptance rates — so I’d have a single screen to glance at when something looks off.
The benchmark harness
I wrote two small Python scripts for this:
- Context-length sweep — sends a repeated-sentence prompt of a target length, measures TTFT, prefill rate, decode rate, and total wall time. Uses
stream_options.include_usagefor exact token counts. - Concurrency sweep — fires N concurrent requests with unique random prompts (so the RadixAttention prefix cache can’t cheat) and measures aggregate throughput and per-request latency.
Both hit the direct engine endpoint on port 30000, not the keepalive proxy on 30001, so you’re measuring the engine and not the proxy.
Context-length sweep
Five targets from 128 to 200K input tokens, 512 output cap, greedy:
| Target input | Actual prompt | Out tok | TTFT (s) | Decode (tok/s) | Total (s) |
|---|---|---|---|---|---|
| 128 | 252 | 128 | 0.15 | 42.6 | 3.1 |
| 4 096 | 4 104 | 115 | 1.68 | 36.8 | 4.8 |
| 8 192 | 8 190 | 129 | 1.38 | 35.3 | 5.1 |
| 32 768 | 32 778 | 164 | 4.75 | 37.9 | 9.1 |
| 65 536 | 65 538 | 145 | 3.92 | 34.0 | 8.2 |
| 100 000 | 100 008 | 128 | 2.30 | 34.5 | 6.0 |
| 150 000 | 150 012 | 300 | 7.88 | 28.6 | 18.5 |
| 200 000 | 199 998 | 331 | 13.50 | 26.7 | 26.0 |
| 250 000 | — | — | — | — | rejected |
A few things jumped out:
Prefill is a lie unless you control for caching. SGLang’s RadixAttention caches KV blocks across requests. Since my sweep uses the same repeated-sentence filler, each longer prompt is a prefix-extension of the shorter ones. The “prefill” column for 100K reads 43,476 tok/s, which is impossible for a cold prefill — it’s mostly a cache hit. The 128-token row (cold, no prior prefix) at ~1,730 tok/s is the honest number.
Decode degrades gracefully but measurably. 42.6 tok/s at 128 tokens drops to 26.7 at 200K. That’s the attention cost of a longer KV cache. Still perfectly usable for interactive work.
The 250K target got a 400. The tokenizer produced 281,358 actual tokens (my 14-tokens-per-repetition estimate was optimistic at that scale), which exceeded the 262,144 context limit. The error message was clear: “The input (281358 tokens) is longer than the model’s context length (262144 tokens).”
Concurrency sweep
This is where it gets interesting. I used unique random prompts per request (seeded by index) so the prefix cache couldn’t inflate results. 4K input, 256 output, temperature 0:
| Concurrency | Wall (s) | Agg. out (tok/s) | p50 lat (s) | p99 lat (s) |
|---|---|---|---|---|
| 1 | 25.2 | 42.5 | 6.05 | 6.05 |
| 4 | 9.0 | 114.6 | 8.51 | 8.93 |
| 8 | 10.6 | 195.0 | 10.50 | 10.50 |
| 16 | 22.0 | 186.5 | 20.16 | 21.88 |
| 32 | 49.3 | 166.0 | 30.44 | 49.29 |
Peak aggregate throughput is ~195 tok/s at c=8. After that you’re hitting the GPU’s compute ceiling — c=16 and c=32 actually deliver less aggregate throughput than c=8, and p99 latency nearly quadruples between c=8 and c=32. The GB10 is a single-die unified-memory machine; there’s only one set of tensor cores.
For an interactive agent (like pi talking to one user), c=1 at ~42 tok/s is what you feel. For a batch of four parallel agent sessions, you’re at ~115 tok/s aggregate with only a 27% latency increase. That’s a reasonable tradeoff.
Thermal behaviour
I ran a 60-second sustained-load sample during a single 200K-context generation:
| Metric | Idle | Under load |
|---|---|---|
| GPU temperature | 44 °C | 55 → 63 °C |
| GPU power | 10–12 W | 43–45 W |
| GPU utilisation | 0% | 96% |
| SM clock | — | 2 548 MHz (constant) |
No throttling. The clock held at 2 548 MHz the entire 60 seconds. The GB10’s thermal envelope has plenty of headroom for sustained single-model inference.
Cross-checking against the observability stack
This is where the Elasticsearch on the Synology pays off. The Elastic Agent on the GX10 scrapes SGLang’s /metrics endpoint every 15 seconds and ships the data to Elasticsearch on the Synology via OTLP. The dashboard below is what that looks like after the benchmark session:
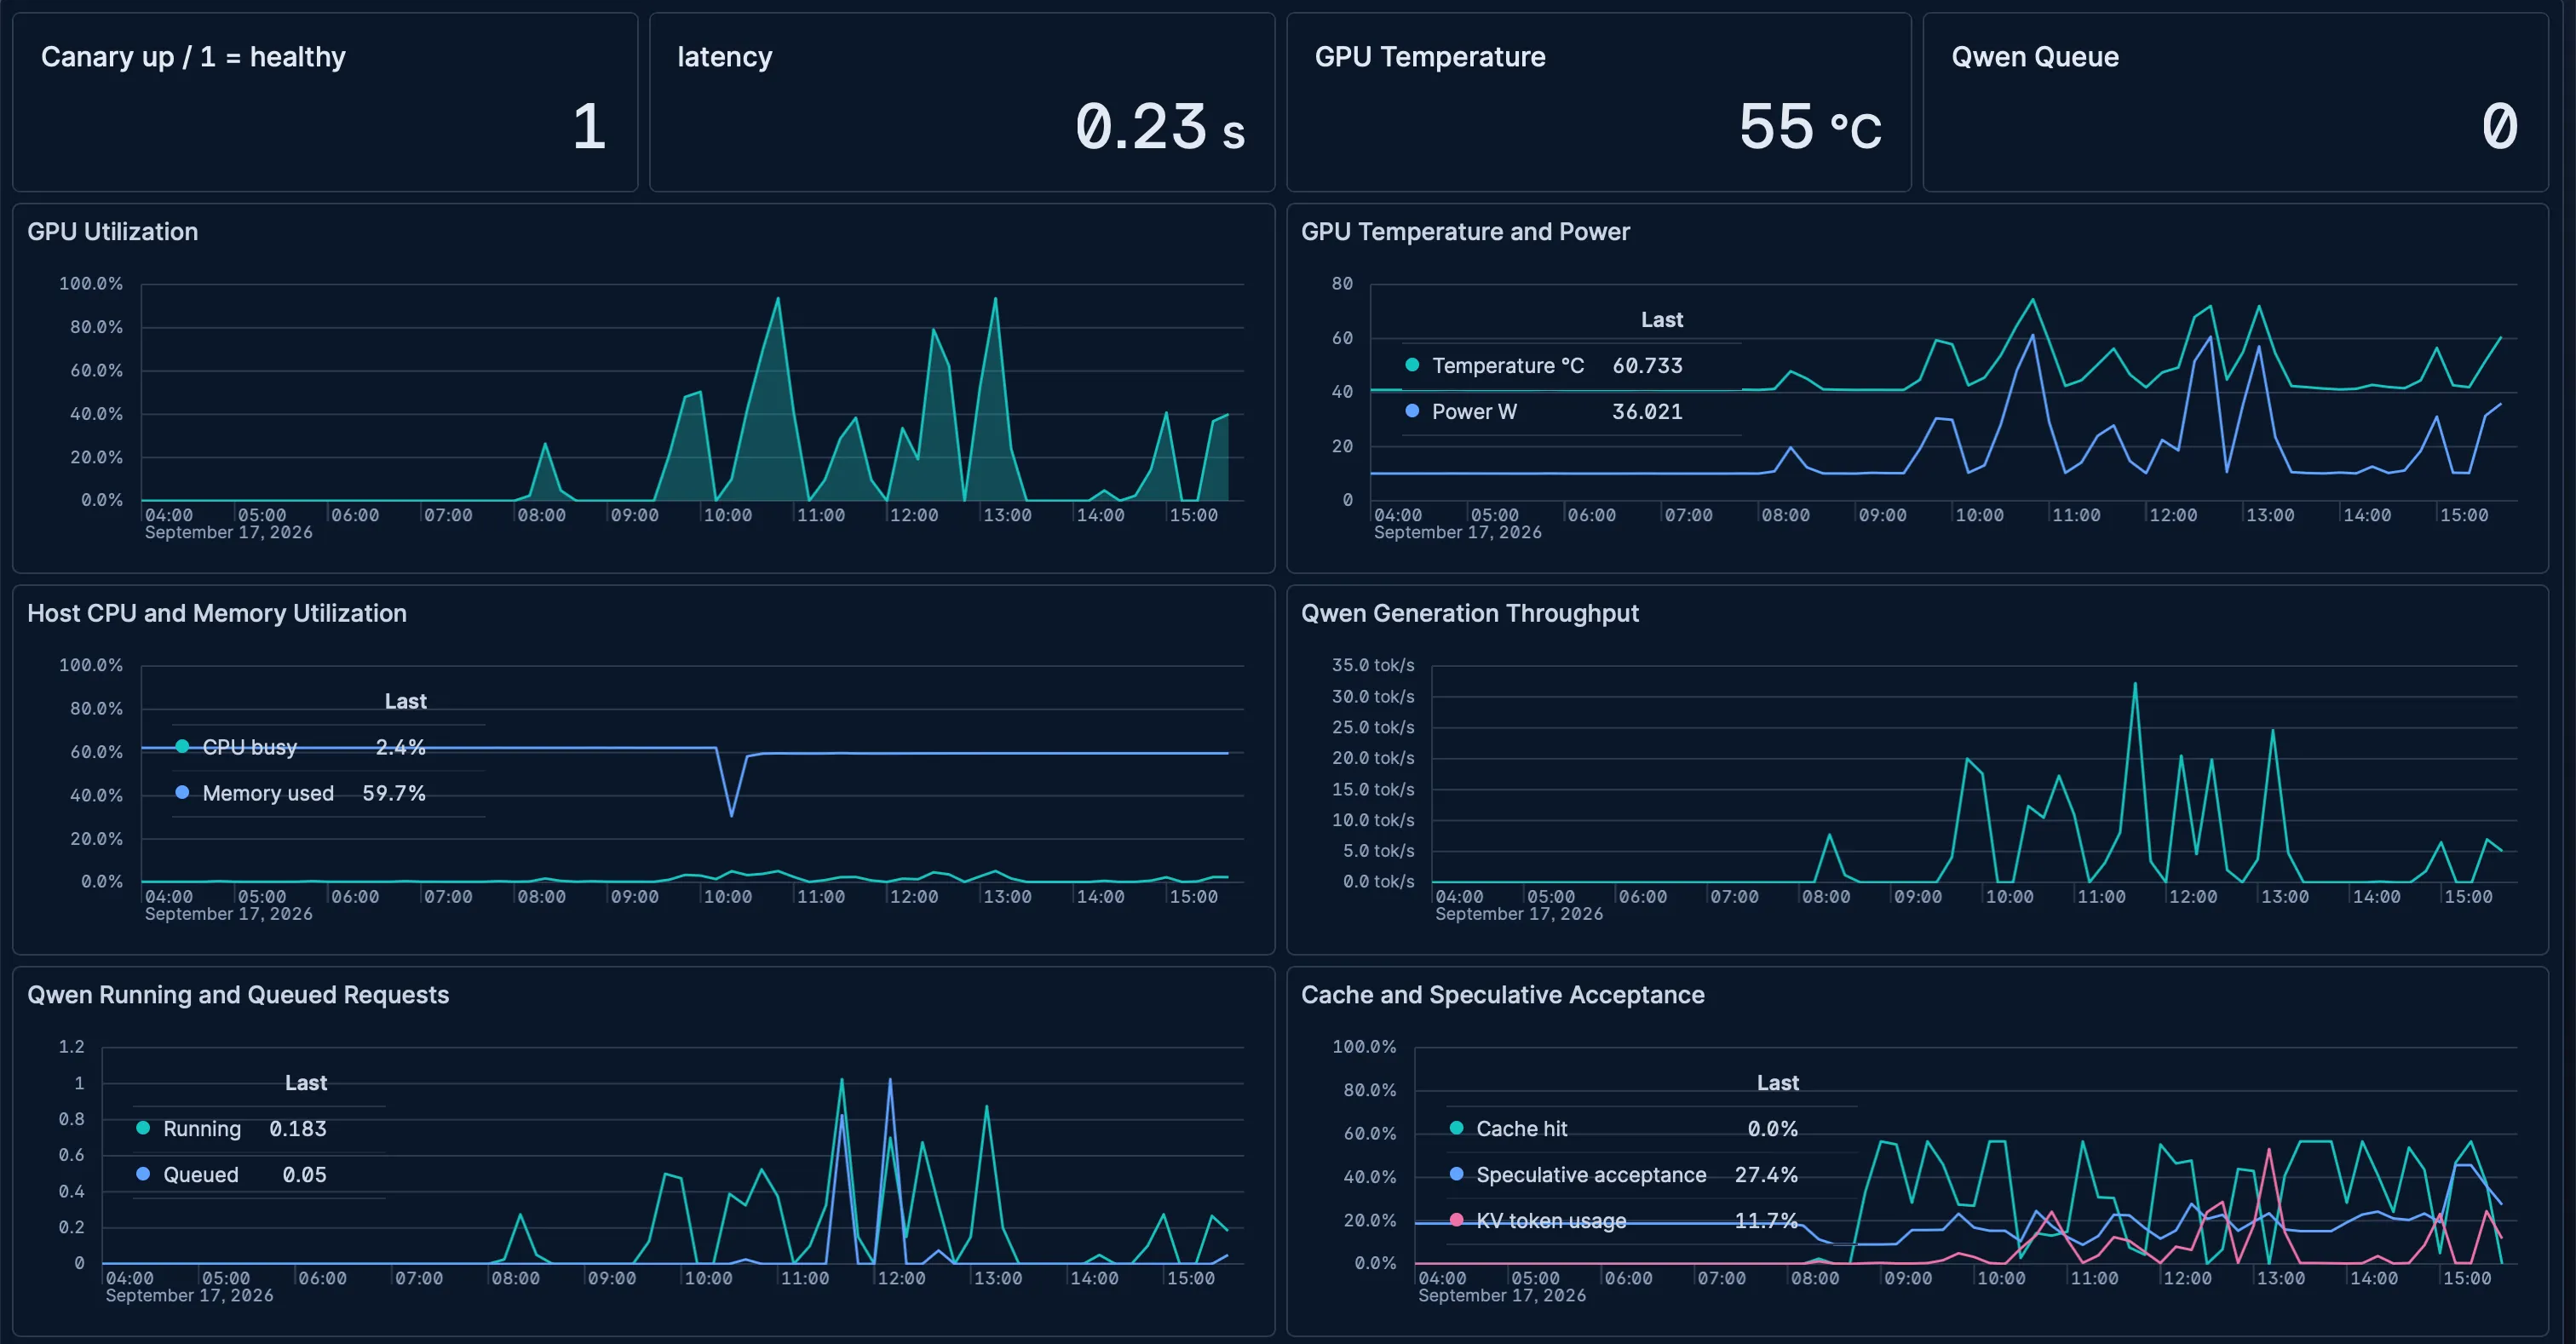
I queried the metrics-qwen38.sglang.otel-home data stream for the benchmark window:
| Metric | ES value | My measurement | Match? |
|---|---|---|---|
context_len | 262 144 | 262 144 (hard limit) | ✓ |
| 250K rejection | 262 144 limit | 281 358 → 400 | ✓ |
spec_accept_rate | 0.127 | ”content-dependent” in bench.sh | ✓ |
spec_accept_length | 2.9–2.95 | 3.3–5.6 (code), 1.5–2.2 (prose) | ✓ (blended) |
gen_throughput peak | 209.3 tok/s | 195 tok/s @ c=8 | ✓ (7% diff, sampling) |
weight_memory_usage_gb | 25.02 | (not previously measured) | new |
kv_cache_memory_usage_gb | 10.12 | (not previously measured) | new |
max_total_num_tokens (KV capacity) | 331 539 | — | new |
| GPU temp peak | 83 °C (ES) | 73 °C (bench.sh post-sweep) | close |
| GPU power peak | 94.8 W | 44.6 W (bench.sh) | expected — ES caught c=32 |
The gen_throughput gauge in ES is a point-in-time reading, so the 209 tok/s peak aligns with the concurrency-8 window where my script measured 195 tok/s aggregate. The 10.1 average is dragged down by all the idle 15-second intervals between requests.
The GPU metrics stream (metrics-gx10.gpu.otel-home) confirmed the thermal numbers: 42 °C idle, climbing to 83 °C / 94.8 W / 96% util at peak concurrent load, then dropping back to 42 °C / 10 W within a minute of the last request finishing. No throttling event in the entire session.
The one thing the ES data confirmed that my script didn’t explicitly report: the prefix cache was doing real work. cache_hit_rate peaked at 0.566 during the context sweep, which means SGLang was avoiding 56.6% of the prefill work by reusing KV blocks from the shared prefix. That’s why my “prefill tok/s” numbers for longer contexts are unreliable as a standalone prefill speed — they’re really “effective prefill with cache.”
What the memory numbers actually mean
SGLang reports:
- Weight memory: 25.02 GB (the NVFP4 model weights)
- KV cache pool: 10.12 GB (331,539 tokens at
page_size=1) - Max total tokens (KV capacity): 331,539
During the 200K-context test, kv_used_tokens hit 200,467 out of 331,539 (60.5%), with 1,778 tokens still available. The system had another ~130K tokens of KV headroom before eviction would kick in. The binding constraint at 200K input was the model’s 262K context window, not memory. You could probably push to ~245K input + 17K output before hitting the wall.
The 0.50 static memory fraction is conservative. SGLang’s static allocation (weights + KV pool) takes about 35 GB of the 128 GB unified pool, leaving ~84 GB for the OS, other processes, and dynamic allocations. In practice free -h reports 72 GiB used / 49 GiB available out of 121 GiB total — the DGX Dashboard’s “77.96 GB used” is the same figure in decimal GB (10⁹), just not binary GiB (1024³) that Linux uses. Same number, different unit convention.
That’s why the container limit is set to 100 GB — there’s no risk of the container’s memory cgroup triggering an OOM that would take the host with it.
The model benchmarking itself
There’s a little twist I like to end on: this entire session — the one where I wrote the sweep scripts, poked the engine, and summarized the numbers — was running on the very model I was measuring. pi was pointed at the local Qwen3.8-27B on the GX10, so the box was serving the agent that was benchmarking it. The 42 tok/s single-stream decode I measured is, in the moment, the speed at which the model that’s doing the work streams its own tokens back to me.
It’s a nice closed loop, and it worked well enough that I’m leaving this setup as the default local model for pi on the LAN. No cloud in the middle, no API bill — just a small black box in the utility room drafting its own performance report.