COVID-19 Obituary Analysis
/ 1 min read
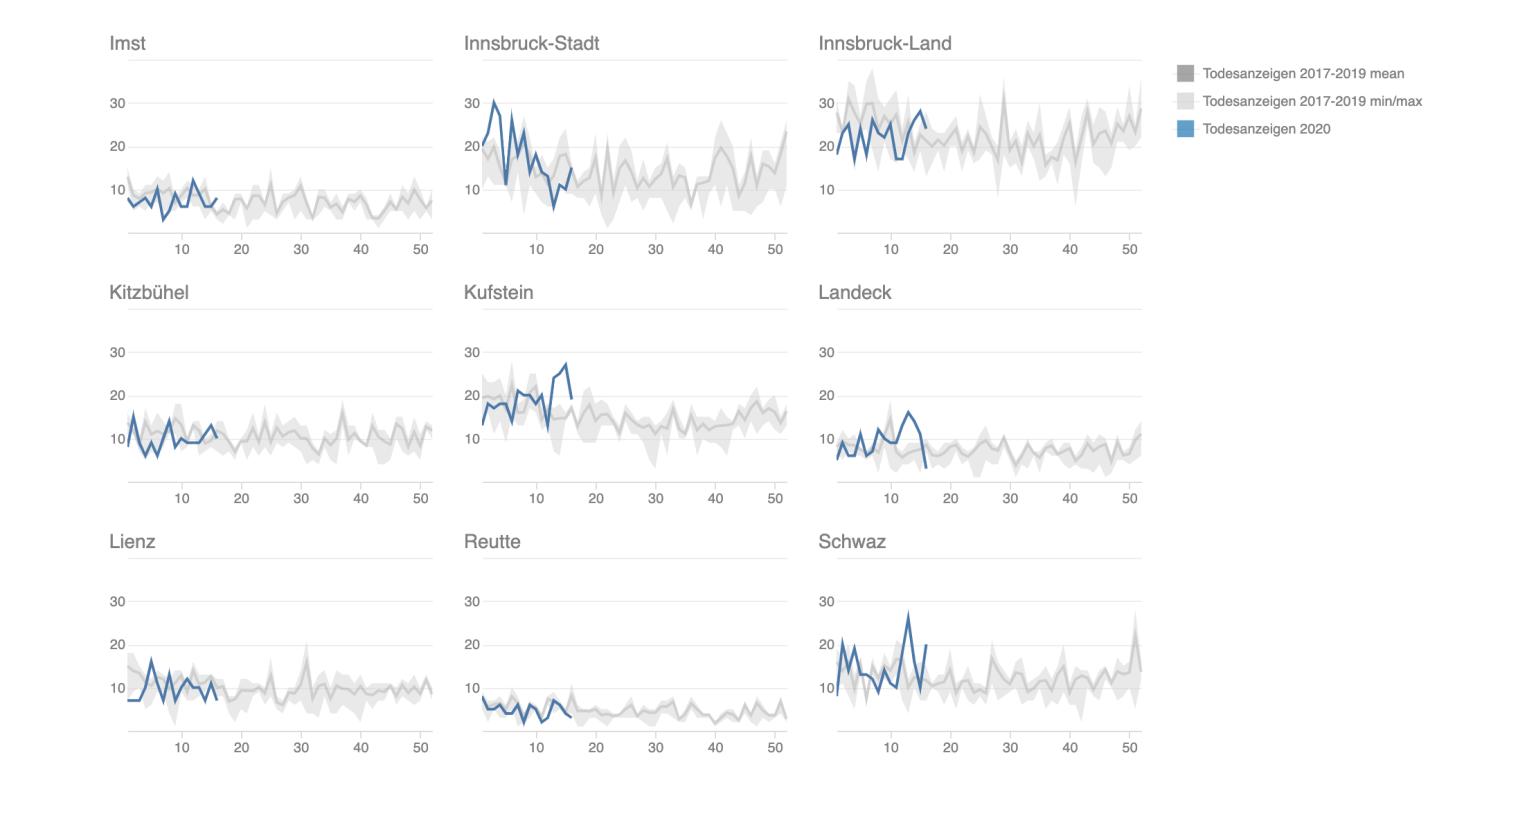
Did another COVID-19 related investigation: Since there’s no granular open data available for regular death rates in Austria, I started to scrape websites with obituary notes. The result is a dataset that allows us to analyse current death rates down to the municipaly level. Here’s a chart that plots the 2020 death rates over the distribution of previous years for each district in Tirol. Districts with higher than average death rates in the past weeks correlate with what we know from news reports: Landeck (with Ischgl/St. Anton) was one of the major sources of the outbreak in Austria. In Kufstein there were reports of eldery homes being affected.

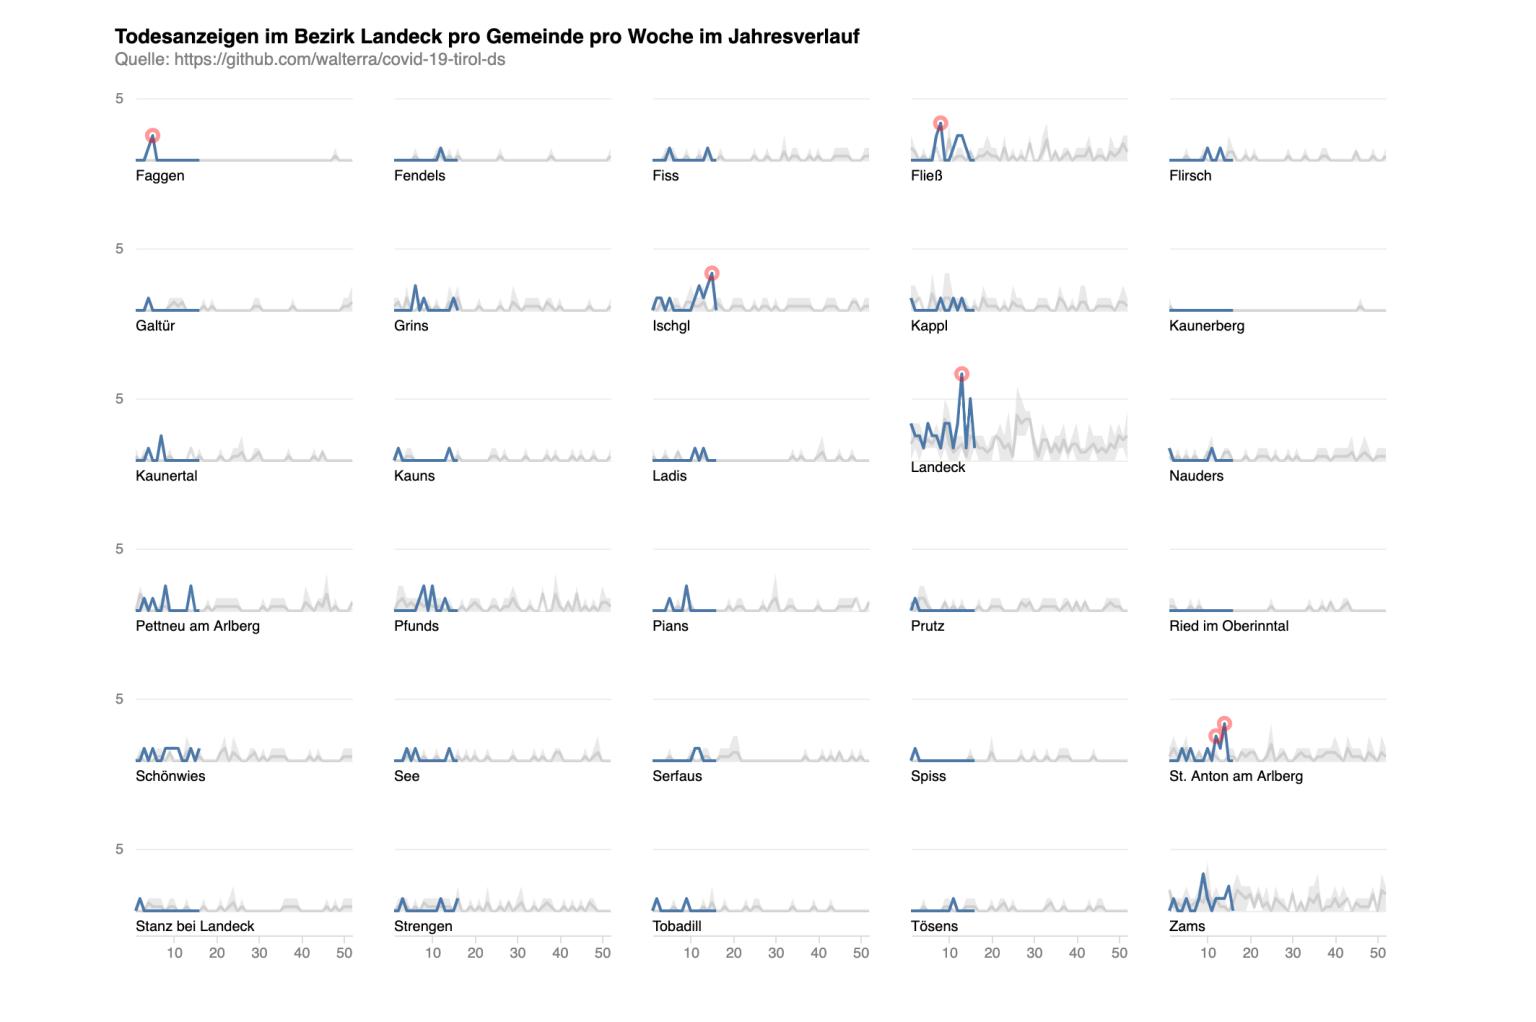
There’s also a variant that features automated annotations to highlight outliers. The results seem to correlate with news reports about COVID-19 cases and fatalities. Instead of using simple thresholds the annotations are identified using Elasticsearch’s Machine Learning. The outlier analysis is based on feature vectors which describe the difference of each data point related previous years and other weeks during these years.

More details, charts, the source data and code is available here: https://walterra.github.io/covid-19-tirol-ds/